When readers search for the highest public debt chart Template , they are usually looking for more than a decorative graphic. They want a structured way to compare countries, rank public debt, show debt relative to economic output, or present historical changes in a format that can be edited for a report, presentation, classroom exercise, policy brief, or financial analysis. A useful template should therefore make the underlying data easy to understand while keeping definitions, dates, units, and sources visible.
The most important design decision is deciding what “highest public debt” means. A ranking based on total currency value can produce a very different result from a ranking based on debt as a percentage of gross domestic product. The International Monetary Fund, World Bank, and OECD publish debt statistics using different coverage and methodological conventions, so a strong chart should identify the exact measure being used rather than treating every public-debt figure as interchangeable.
A practical the highest public debt chart Template can be built around a simple dataset containing country, year, debt measure, GDP, debt-to-GDP ratio, source, and notes. From that foundation, the same data can support a horizontal ranking, a time-series line chart, a regional comparison, a historical trend, or a dashboard-style graphic. The objective is not merely to make the chart attractive; it is to make the comparison defensible and easy for another reader to reproduce.

What a public debt chart template should show
A public debt chart should begin with a clearly defined measure. “Gross government debt” generally refers to the stock of government liabilities before subtracting certain financial assets, while “net debt” deducts specified financial assets. The OECD also distinguishes public-sector debt from general-government debt, because public-sector measures can include public corporations in addition to government institutions. A template that does not state its coverage can therefore create a misleading impression of precision.
For international comparison, debt-to-GDP is often more informative than a raw currency amount because it relates the stock of liabilities to the size of the economy. The World Bank’s public-sector debt database provides country and cross-country statistics in nominal currency and as a percentage of GDP, while the IMF maintains several debt datasets covering different periods and concepts. These sources make it possible to construct charts with a consistent denominator and documented methodology.
The chart should also identify the reference period. Annual debt figures, quarterly observations, fiscal-year measurements, and calendar-year measurements are not automatically interchangeable. A reader comparing two countries needs to know whether both observations represent the same period and whether projections have been mixed with historical observations. A strong template separates actual values from estimates or projections and uses a visible note whenever the status of the data changes.
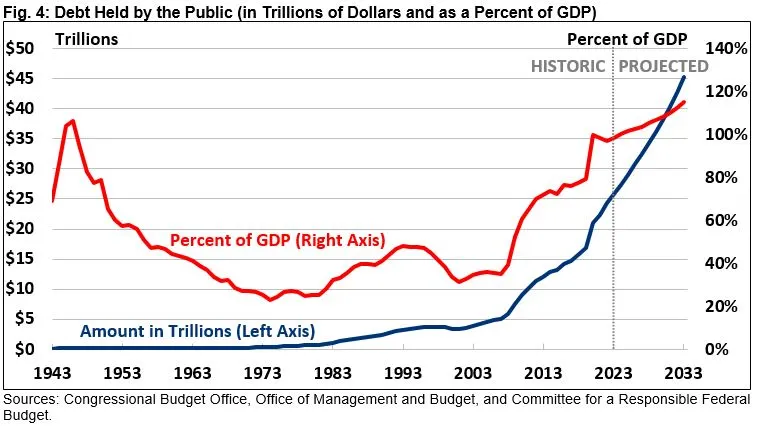
Choosing the right debt metric
The first choice is usually between nominal debt and debt as a share of GDP. Nominal debt is useful when the purpose is to show the scale of government liabilities in currency terms. It can be particularly effective for a single country because it communicates how the debt stock has changed over time. However, nominal values can rise simply because the economy and price levels have grown, so they are not always suitable for comparing countries.
Debt-to-GDP provides a normalized measure. A country with a large economy can carry a larger nominal debt stock than a smaller economy while still having a lower debt burden relative to its output. This is why many international public-finance charts use the ratio as the principal comparison measure. The IMF Fiscal Monitor and World Economic Outlook datasets regularly present gross government debt in relation to GDP, making the ratio especially useful for cross-country rankings.
Net debt is another useful option when the analytical question concerns liabilities after considering selected financial assets. It should not, however, be casually substituted for gross debt. If a chart ranks countries using gross debt and another ranks them using net debt, the two lists may differ substantially. A template should therefore put the metric in the title or subtitle and repeat it on the vertical axis or legend.
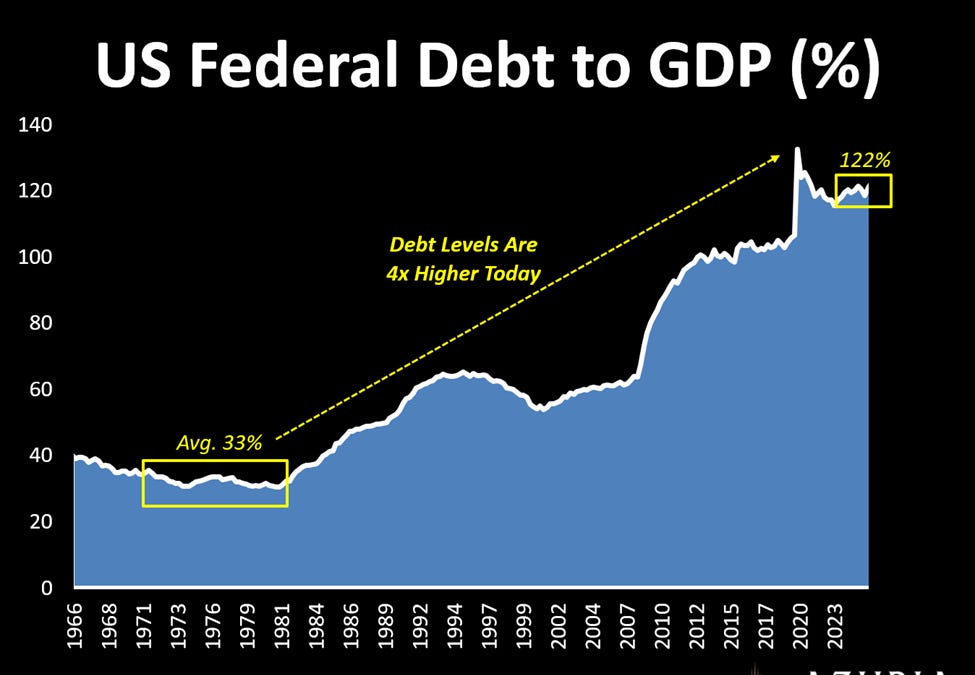
How to structure the underlying dataset
A reliable chart begins with a clean data sheet rather than with chart formatting. At minimum, create fields for country, period, debt value, debt unit, GDP value if needed, debt-to-GDP ratio, data status, source, and source date. Keeping these fields together means that the chart can be updated without rebuilding the research record. It also makes it easier to identify a mistaken country, duplicate observation, missing year, or inconsistent unit.
If the chart ranks countries, store one observation per country for the selected reference period. If it shows history, use one row per country and period. Avoid combining annual and quarterly figures in the same ranking unless the methodology explicitly calls for that comparison. A separate “status” field can distinguish historical observations from estimates and projections, which is particularly useful when the chart extends beyond the latest completed reporting period.
Source documentation should remain attached to the data rather than being added only after the graphic is finished. The IMF Historical Public Debt Database covers a long historical period, while the World Bank and IMF Quarterly Public Sector Debt database supplies detailed quarterly observations for participating countries. OECD government-finance statistics provide another important source for standardized government and public-sector measures. The best source depends on the exact definition required by the chart.

Designing a ranking of the highest public debt
A ranking chart works best when the countries are ordered from the highest ratio to the lowest ratio rather than alphabetically. Horizontal bars are usually easier to read than vertical bars when country names are long. Direct data labels can show the percentage at the end of each bar, reducing the need for a separate legend. The selected reference year should appear prominently in the heading so readers do not mistake the ranking for a timeless classification.
Do not use color as the only signal for rank or category. A readable chart should still make sense in grayscale or when viewed by readers with color-vision differences. A restrained palette, consistent labels, and adequate spacing generally communicate more effectively than a chart filled with decorative elements. If a threshold is important, such as a policy benchmark, it can be represented by a clearly labeled reference line rather than by an arbitrary color scheme.
The phrase “highest public debt” can also refer to two different ranking questions: the countries with the highest absolute debt and the countries with the highest debt relative to GDP. Those rankings should never be merged without explanation. A large economy may dominate an absolute-debt ranking while a different country leads a debt-to-GDP ranking. A good template explicitly states which ranking is being presented.

Why debt-to-GDP is central to international comparisons
Debt-to-GDP is a ratio, not a direct measure of whether a government can or cannot repay its obligations. It provides context by comparing the stock of government debt with the economic output generated during a period. Interpretation still requires other information, including fiscal balances, interest costs, economic growth, inflation, maturity structure, currency denomination, creditor composition, and the broader institutional setting.
The World Bank notes that its Quarterly Public Sector Debt database supports cross-country comparison by presenting debt information in standardized formats. The database distinguishes different sectors and debt concepts, including general government, central government, and broader public-sector measures. This distinction matters because a chart can change substantially depending on which institutional perimeter is selected.
The OECD similarly emphasizes that public-sector debt can include financial and non-financial public corporations in addition to general government. Its tables also provide breakdowns by liability type, maturity, creditor residence, and currency denomination. These dimensions are valuable when a simple ranking needs to be expanded into a deeper analytical dashboard.
Historical trend charts versus ranking charts
A ranking answers “who is highest?” while a time-series chart answers “how has the measure changed?” The two formats serve different purposes and should not be forced into one crowded graphic. A ranking can highlight a single reference year, whereas a line chart can reveal turning points, long periods of stability, crisis-related increases, or subsequent reductions in debt ratios.
For historical analysis, the x-axis should use a consistent time interval. Annual observations are generally easiest to read when the purpose is a long-run comparison. Quarterly data are more useful for monitoring recent changes, but they can create visual noise when displayed across several decades. A template can therefore include a selector or clearly separated versions for annual and quarterly analysis.
Historical charts also need careful treatment of revisions. Official economic datasets can be revised as governments update national accounts or improve statistical methods. A chart that is intended to remain useful should record the retrieval or publication date and avoid implying that historical values are permanently fixed. This is especially important when a graphic is used in a report that may be updated later.

Using regional comparisons effectively
Regional charts are useful when a global ranking contains too many countries to read comfortably. A regional version can compare economies within Europe, Asia, Africa, the Americas, or another defined group. The same metric and reference period should be retained across all regions so that the regional charts remain comparable.
One useful design is a small multiple: each region receives a separate panel using the same horizontal scale. This makes differences in distribution easier to see than placing dozens of countries into one dense chart. Another option is a regional bar chart that ranks countries while using a small marker or label to identify the regional average.
Care is needed when regional aggregates are used. A simple arithmetic average of country debt ratios is not necessarily the same as a GDP-weighted regional ratio. If the source provides an official aggregate, use that aggregate rather than calculating a new one without explaining the method. The methodology note should state whether the figure is weighted and what population of countries is included.

Comparing major economies
Charts of major economies often provide a useful reference point for readers who want to understand where a country sits relative to peers. A multi-line chart can show Japan, the United States, France, Italy, Germany, Canada, and the United Kingdom on the same percentage-of-GDP scale. The advantage is that changes in relative position become visible over time rather than being reduced to one year.
Japan is a useful example of why scale matters. Its government debt ratio has been substantially higher than that of many other advanced economies for a long period. The United States also has a high gross government debt ratio, while Germany has historically operated at a lower ratio than several major European peers. These differences should be presented descriptively rather than interpreted as a simple ranking of economic health.
A chart comparing large economies should also make the data source explicit. The IMF, national statistical agencies, central banks, and international databases can publish figures with different definitions. If two sources disagree, the template should not quietly choose one value. Instead, select the source that best matches the intended definition and record the methodological reason.

Building an Excel-style template
A useful the highest public debt chart template excel structure can start with a raw-data sheet, a calculation sheet, and a chart sheet. The raw-data sheet stores the source observations without changing them. The calculation sheet derives ratios, rankings, changes from the previous period, and regional classifications. The chart sheet then displays the selected view without requiring the underlying research data to be reformatted.
Use formulas rather than manually typed ranking positions whenever possible. If debt-to-GDP is calculated from debt and GDP, keep the formula visible in the working area. If the ratio comes directly from an authoritative dataset, preserve the published value and identify it as sourced data. This distinction prevents accidental double calculation or rounding differences.
For maintenance, create consistent country names and period formats. “United States,” “USA,” and “US” should not appear as three different country labels in the same dataset. Similarly, percentages should be stored numerically rather than as text when they will be used for sorting or charting. These small data-management decisions make the template much more reliable.

Building a Google Sheets-style template
The same structure works for the highest public debt chart template google sheets. The key principle is to keep source data separate from presentation. One tab can hold the original observations, another can contain calculations, and a third can contain the ranking or time-series chart. This organization makes collaboration easier because chart formatting does not interfere with the underlying data.
Conditional formatting can be used sparingly to emphasize unusually high ratios, but the main ranking should remain understandable without visual effects. Filters can help users select a year, region, or debt concept. A separate metadata area can record the source, publication date, unit, definition, and whether the values are historical or projected.
Google Sheets-style workflows are particularly useful when several researchers need to review the same dataset. One person can verify country coverage, another can check the source definitions, and another can review the final visual hierarchy. The result is more dependable when the template makes every important assumption visible instead of hiding it inside the chart.

Preparing a document or PDF version
For a report-oriented layout, the highest public debt chart template google docs can be treated as a document structure rather than a specialized data system. The chart should sit near a concise explanation of the metric, source, period, and interpretation. A separate source note below the graphic can identify the dataset and the date on which the figures were retrieved.
A printable report can also use the highest public debt chart template pdf as a conceptual format: one title, one main chart, a short methodology note, and a source statement. The important point is that the visual should remain readable when reduced to page size. Tiny axis labels, long legends, and dense annotations often become difficult to interpret once a chart is placed inside a document.
If the chart is intended for formal reporting, retain enough white space around the graphic for the title and source note. Keep units consistent across pages and use the same terminology throughout the report. A multi-page debt report should feel like one coherent analytical product rather than a collection of unrelated charts.
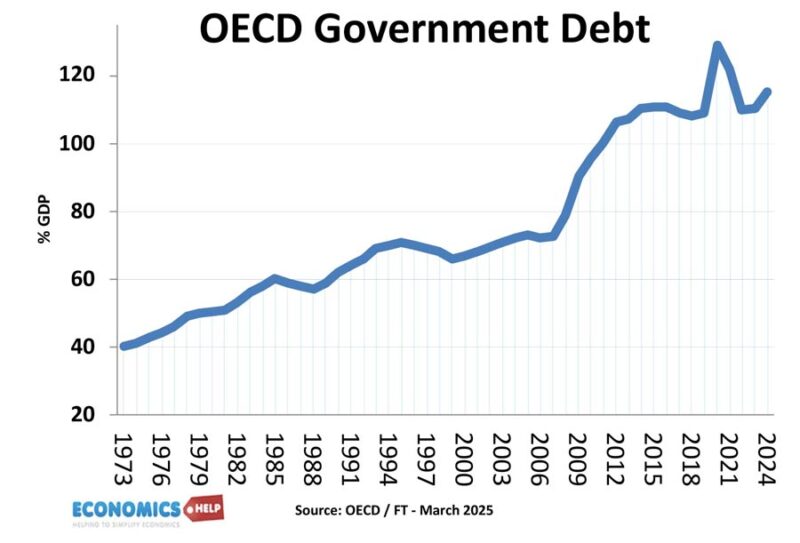
Understanding debt ratings alongside debt charts
A public debt ratings chart can complement a debt-to-GDP chart, but the two should not be treated as equivalent measures. A debt ratio describes a quantitative fiscal position, while a credit rating reflects an assessment by a rating agency based on a broader set of factors. Those factors can include fiscal performance, institutional strength, economic prospects, financing conditions, and vulnerability to shocks.
Including a rating column in a dashboard can help readers examine whether countries with similar debt ratios receive similar market assessments. However, differences in rating methodology mean that a rating should be attributed to its specific provider and date. Ratings can also change independently of the debt ratio, so the chart should avoid suggesting a mechanical relationship.
The strongest layout places the debt ratio and rating in separate columns or visual elements. This keeps the underlying concepts distinct while allowing readers to consider them together. If the purpose is educational, a note can explain that a high debt ratio does not automatically imply a particular rating outcome.

How to show the national debt chart clearly
The phrase the national debt chart is often used for a single-country historical graphic. Such a chart can show the debt stock in currency units, the debt-to-GDP ratio, or both. If both are presented, use separate axes only when the relationship is genuinely useful and the scales are clearly labeled.
A dual-axis chart can be powerful because it shows how the nominal debt stock and the debt burden can move differently. Nominal debt may rise while debt-to-GDP falls if the economy grows faster than the debt stock. Conversely, a recession can push the ratio higher even if the nominal debt increase is relatively modest. This is why readers should not interpret a single line without considering the denominator.
For a long historical series, major economic events can be marked with restrained annotations. Wars, financial crises, recessions, policy changes, or extraordinary fiscal measures can explain abrupt changes in the line. These annotations should be factual and sourced rather than speculative. A clean chart with a few meaningful markers is usually more informative than one crowded with commentary.
Reading a public debt chart correctly
Start by reading the title and subtitle before looking at the ranking. Identify whether the chart measures gross or net debt, general government or public-sector debt, and currency value or percentage of GDP. Then check the period. A chart showing 2024 observations should not be interpreted as a current 2026 position unless the source has updated it.
Next, inspect the axis. A bar chart with a truncated vertical axis can visually exaggerate relatively small differences. A line chart with irregular time intervals can create misleading slopes. If the chart includes projections, look for a visual distinction between historical observations and forward estimates. These details are not cosmetic; they affect interpretation.
Finally, inspect the source and methodology. A chart can be visually polished and still be unsuitable for serious analysis if its underlying definitions are unclear. When two charts disagree, first compare their coverage, period, valuation method, and source before concluding that one of them is incorrect.

Common mistakes when creating public debt charts
One common mistake is mixing debt concepts. A chart may combine general government gross debt for one country with central government debt for another. Even if both numbers are labeled “public debt,” the comparison may not be valid. The solution is to select a consistent definition or clearly label differences in coverage.
Another mistake is mixing years. A ranking may accidentally contain 2024 data for some countries and 2025 data for others because those are the latest values available. That can be acceptable for a “latest available” dashboard, but it should be stated explicitly. For a strict year ranking, countries without observations for the chosen year should be marked as unavailable rather than silently substituted with another period.
A third mistake is confusing debt with deficit. Debt is a stock measured at a point or over a defined reporting period, while the fiscal deficit is a flow accumulated during a period. A deficit can increase debt, but the two indicators answer different questions. A high-quality template keeps them in separate fields and labels them clearly.

Making the chart useful for research and reporting
For research, the most valuable feature is traceability. Every figure should be connected to a source, period, and definition. If an editor asks where a value came from, the researcher should be able to locate the original observation without rebuilding the analysis from memory.
For a business or policy report, clarity is equally important. A decision-maker may spend only a short time looking at the chart, so the central message should be visible immediately. If the purpose is to identify the countries with the highest debt ratios, rank them clearly and avoid burying the result under unnecessary historical detail.
For education, the template can include more methodological explanation. Students can compare absolute debt with debt-to-GDP, investigate how rankings change over time, and learn why different institutions can report different figures. The chart then becomes a framework for understanding public finance rather than simply a graphic for displaying numbers.

Practical Solution
To build a dependable the highest public debt chart Template , begin by defining the exact question. Decide whether the goal is to rank countries by gross debt-to-GDP, show the largest nominal debt stocks, track one country historically, or compare several economies over time. Write that definition into the chart subtitle before collecting data. This single step prevents many later errors because it establishes what the chart is actually intended to measure.
Next, choose one authoritative dataset that matches the definition. The IMF Historical Public Debt Database is useful for long-run historical analysis, while the IMF Fiscal Monitor and World Economic Outlook datasets provide broader contemporary fiscal indicators. The World Bank and IMF Quarterly Public Sector Debt database is useful for detailed public-sector comparisons, and OECD government-finance statistics provide another standardized source for government and public-sector measures. Record the source, reference period, unit, coverage, and whether each value is historical or projected.
Then create a clean working dataset with one row per country and period. Add a calculated ranking field and a change field showing movement from the previous observation when historical data are available. Sort the selected year from highest to lowest for a ranking chart. Use horizontal bars for country comparisons, lines for historical trends, and maps or regional panels only when geographic context adds genuine value. Keep the title, unit, reference year, and source close to the visual.
Finally, audit the finished chart. Confirm that every country uses the same definition, that the periods are comparable, that the ranking order matches the data, and that rounding has not changed the apparent order of closely matched countries. Check every label, axis, legend, and source note. If projections are present, distinguish them from historical values. A template becomes genuinely useful when another reader can understand what it measures and reproduce the chart from the documented data without having to guess the methodology.
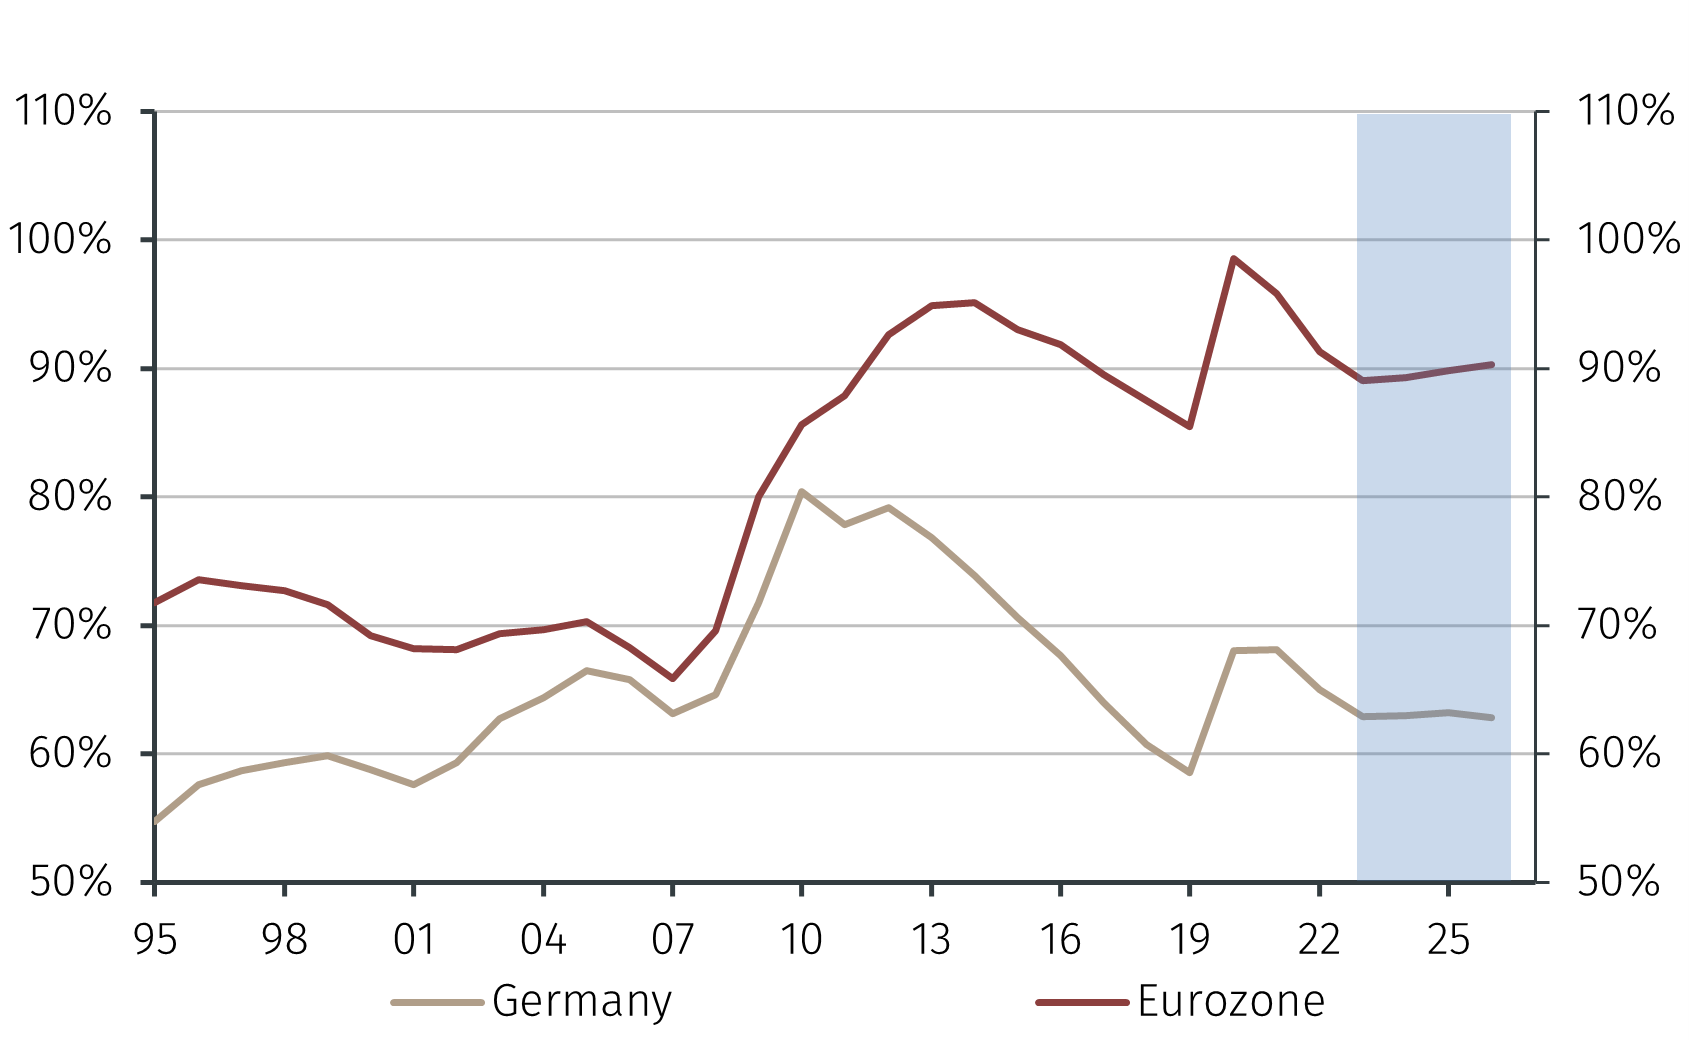
Practical examples of chart layouts
A simple ranking layout can contain the title “General Government Gross Debt as a Percentage of GDP,” a selected year, ten horizontal bars, direct percentage labels, and a concise source line. This is appropriate when the reader mainly needs to identify the highest ratios. It is also easy to reproduce in spreadsheet software because the visual structure follows the underlying ranking order.
A historical layout can place years along the horizontal axis and debt-to-GDP on the vertical axis. Multiple countries can be shown as separate lines, provided the number of series remains manageable. If there are many countries, a small-multiple layout is preferable to a dense collection of crossing lines. The goal is to reveal trends without making the reader decode a tangled legend.
A dashboard layout can combine a current ranking, a five-year change indicator, a historical sparkline, and a source note. Such a design is useful for recurring monitoring because it separates the current snapshot from the longer-term trend. The dashboard should still use the same underlying definition throughout so that each visual answers a related question.
Keeping the template current
Public debt data change as national accounts are revised and new reporting periods become available. A template should therefore include a visible “data through” field. This prevents a reader from assuming that a chart created several months earlier represents the latest position.
When updating the dataset, preserve the previous version of the source information and record the new publication date. If a statistical agency revises a historical series, the revised values should normally replace the earlier values in the active dataset, while the revision itself can be documented in the notes. This creates a clear audit trail.
A recurring chart should also be tested after each update. New countries may appear, older observations may be revised, and projections may become historical values. A formula or ranking that worked correctly last year may therefore require review. Treating the chart as a maintained analytical asset rather than a one-time graphic produces much more dependable results.

Final checks before publishing
Before publishing a public debt chart, check the definition first, then the period, then the source. Confirm that the title matches the actual metric and that the axis uses the same unit described in the title. Check whether the values are gross or net and whether they cover general government, central government, or the wider public sector.
Review the ranking visually and numerically. Countries with similar values should be ordered correctly, and the chart should not imply precision beyond the source data. If values are rounded to whole percentages, use consistent rounding across every country. If the source publishes one decimal place, retaining that precision may be useful when the ranking is close.
Finally, read the chart as if you had never seen the dataset. Ask whether a reader can tell what is being measured, when it was measured, where it came from, and what the ranking means. If those questions can be answered without additional explanation, the template is doing its job.

Reference Examples
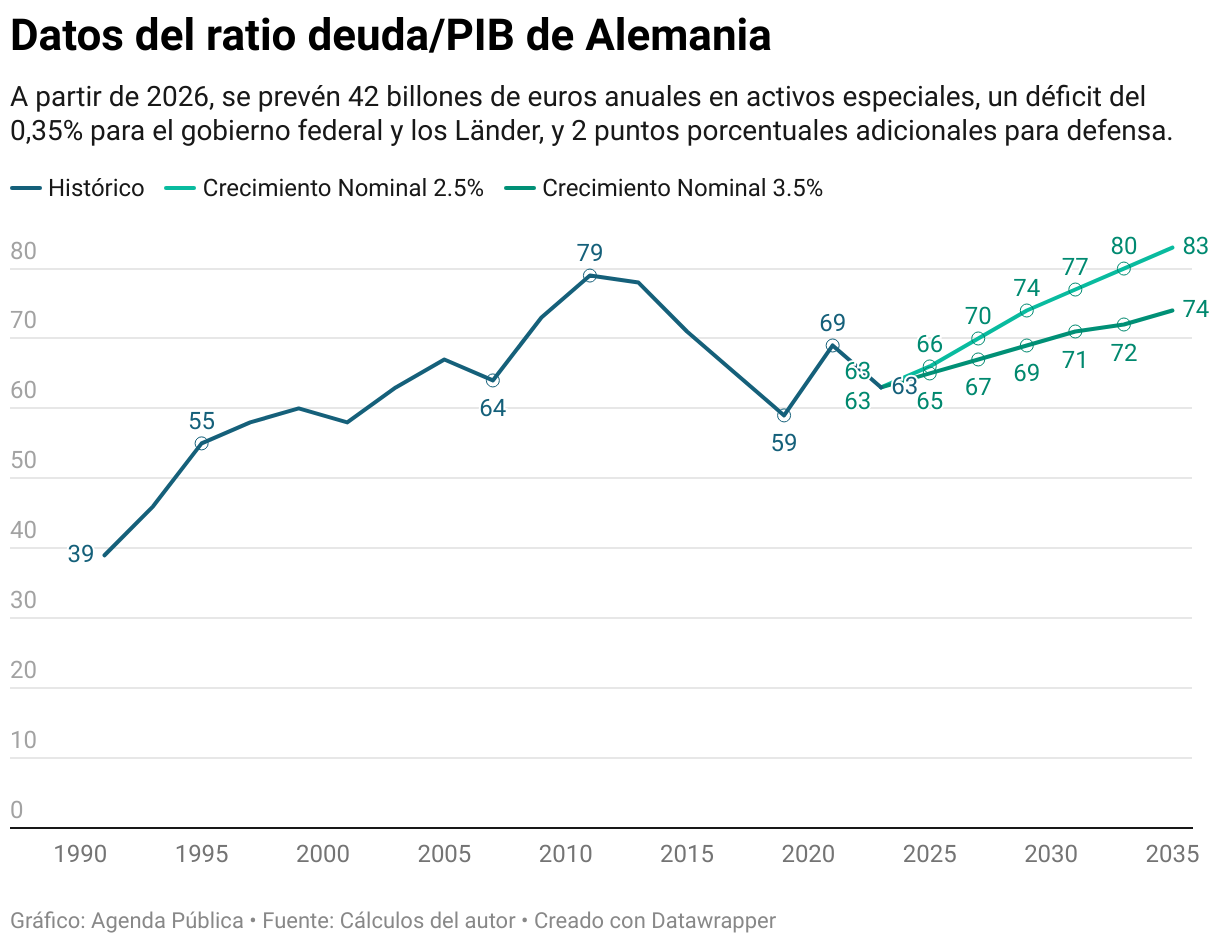
The following visual references show how the highest public debt chart Template can be interpreted through different chart forms, periods, and comparison groups. Some examples emphasize one country over time, while others compare multiple economies or display debt as a percentage of GDP. Together they demonstrate why the title, unit, reference period, and source should remain visible whenever a public debt chart is used for research or reporting. They also show how line charts, bar charts, area charts, and comparative graphics can communicate different aspects of the same broad subject.
These references are useful when evaluating a proposed the highest public debt chart Template because they provide visual benchmarks for hierarchy, labeling, historical context, and cross-country comparison. A good template does not need to imitate any one example. Instead, it should borrow the strongest structural ideas: direct labels, consistent scales, clear definitions, visible source information, and a layout that matches the question being asked. The examples below can therefore help readers recognize which visual approach is most appropriate for a particular public-debt dataset.

Gross public sector debt as a share of gross domestic product, France
Source: Our World in Data via Wikimedia Commons

Gross public sector debt as a share of gross domestic product, South Africa
Source: Our World in Data via Wikimedia Commons

Gross public sector debt as a share of gross domestic product, United States
Source: Our World in Data via Wikimedia Commons

Gross public sector debt as a share of gross domestic product, World
Source: Our World in Data via Wikimedia Commons

Gross public sector debt as a share of gross domestic product, Asia
Source: Our World in Data via Wikimedia Commons

Gross public sector debt as a share of gross domestic product, North America
Source: Our World in Data via Wikimedia Commons
Government Debt-to-GDP Trends in Germany and the Eurozone
Source: EFG International
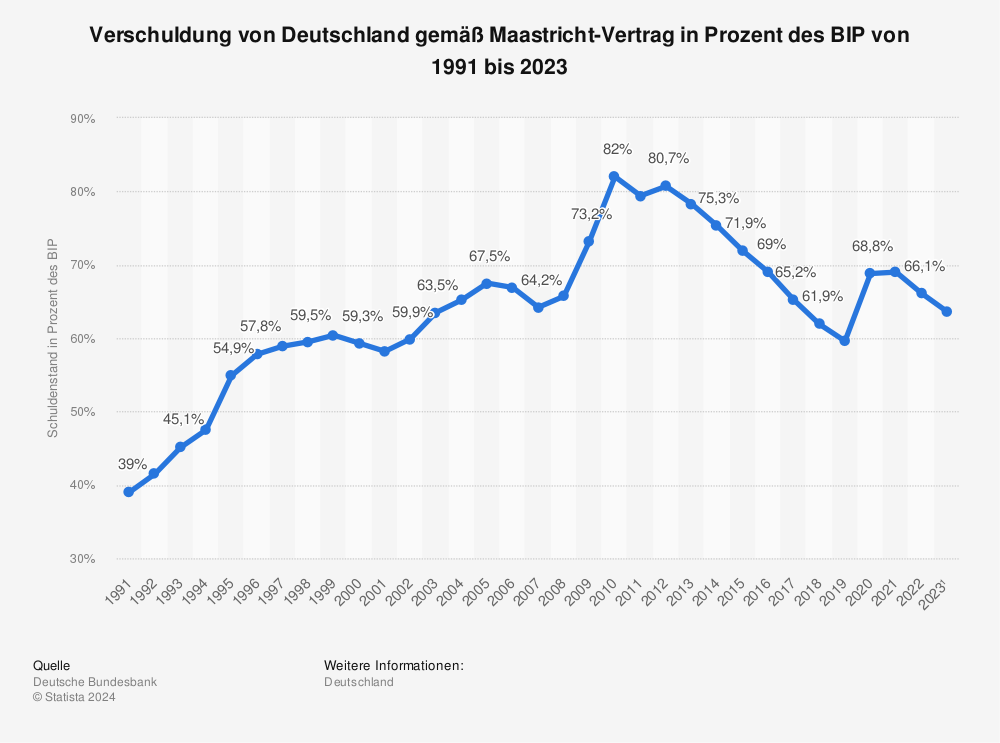
Germany’s Debt-to-GDP Ratio Under Maastricht Criteria
Source: Statista
Germany’s Debt-to-GDP Ratio: Past Trends and Future Projections
Source: Agenda Pública
