A realestate investment bi Template is best understood as a structured framework for turning property, financing, operating, valuation, and portfolio data into a decision-ready business intelligence dashboard. Instead of keeping purchase assumptions, rent schedules, expenses, debt balances, and return calculations in disconnected worksheets, a well-designed template connects those inputs to a consistent set of metrics and visual reports. The goal is not simply to make a spreadsheet look polished. The goal is to make investment decisions easier to review, explain, compare, and challenge.
Business intelligence, or BI, adds an important layer to traditional real estate financial modeling. A conventional workbook may calculate cash flow correctly while still making it difficult to identify which property is creating value, which assumption is driving risk, or how portfolio performance has changed over time. A BI-oriented structure solves that problem by organizing data around properties, periods, transactions, financing, operating results, and investment outcomes. The result can support acquisition screening, asset management, portfolio reporting, and scenario analysis from one consistent analytical framework.
Current real estate dashboard examples commonly combine portfolio value, rental income, occupancy, operating costs, net operating income, return measures, and projected cash flow. Those measures are useful because they connect operational performance with investment performance rather than treating them as separate subjects. A strong template therefore starts with the decisions an investor needs to make and works backward toward the data required to support those decisions.
What a real estate investment BI template should accomplish
The most useful template creates a clear chain from source data to calculations to decisions. Property records provide the foundation, including acquisition date, purchase price, property type, location, units, floor area, current value, and ownership status. Operating records then add rent, vacancy, other income, maintenance, taxes, insurance, management costs, and capital expenditures. Financing records contribute loan amount, interest rate, amortization, maturity, and debt service. The BI layer turns these inputs into portfolio-level and property-level views.
A good structure should also separate inputs from calculations and outputs. This makes the model easier to audit and reduces the risk that someone accidentally overwrites a formula. An investor might enter a purchase price, expected rent growth, vacancy assumption, financing rate, and exit cap rate in an assumptions area. Calculations can then derive net operating income, debt service, cash flow, equity requirements, valuation, and return measures. The dashboard should show the results without forcing the reader to inspect every underlying formula.
The template should answer practical questions quickly. Which assets have the strongest cash flow? Which properties have the highest debt burden? Where is occupancy deteriorating? How much equity is tied up in each property? Which assumptions have the greatest effect on IRR? What happens if rent growth slows or the exit value falls? These questions are more important than the visual appearance of the dashboard because they determine whether the model actually improves investment decisions.
Start with a clean property data model
The first practical layer is a property register. Each property should have a stable identifier so that rents, expenses, loans, valuations, and transactions can be connected without relying on property names alone. Useful fields include property ID, address or geographic label, asset class, acquisition date, acquisition cost, current valuation, unit count, floor area, occupancy status, and ownership share. For larger portfolios, standardized identifiers become particularly important because a single property may appear in leasing, accounting, debt, and valuation records under slightly different names.
The next layer captures time-dependent information. Rent, occupancy, expenses, debt balances, valuations, and cash flows change over time, so the model should preserve historical periods rather than replacing previous values. A monthly structure is often useful for detailed cash-flow analysis, while quarterly or annual summaries can support executive reporting. The important principle is consistency: the same period definitions should be used across income, expenses, financing, and performance metrics.
A third layer records investment events. Acquisition costs, renovations, refinancing, capital contributions, distributions, sales, and other major transactions should be identifiable separately from recurring operating activity. This prevents an investor from confusing a one-time capital expenditure with ordinary operating costs. It also makes it easier to reconcile the dashboard to bank records, accounting statements, loan schedules, and transaction documentation.
Core financial inputs to include
A useful real estate investment model begins with acquisition assumptions. Purchase price, closing costs, renovation spending, initial reserves, financing fees, and the initial equity contribution determine the capital required to enter a deal. These inputs should be visible and clearly distinguished from calculated values. If a value is estimated rather than verified, it should be labeled as an assumption so the reader knows that the result depends on it.
Operating assumptions should cover rental income and recurring costs. Depending on the property, this may include scheduled rent, other income, vacancy, concessions, property taxes, insurance, repairs, maintenance, utilities, management fees, reserves, and recurring capital expenditures. The model should distinguish expenses that affect net operating income from financing costs that belong below NOI. This separation is essential because property operating performance and financing structure answer different investment questions.
Exit assumptions should be treated with the same discipline. A model may include a planned sale date, expected sale price, exit capitalization rate, selling costs, remaining debt, and estimated net sale proceeds. These figures are not facts about the future; they are scenario inputs. A robust BI template makes that distinction visible and allows the investor to compare multiple exit assumptions rather than presenting one forecast as if it were certain.
Key metrics for a real estate investment BI dashboard
Net operating income is one of the most important operating measures. It generally represents property revenue less operating expenses before financing costs and other items that are outside property operations. Because NOI is connected to both operating performance and valuation, it provides a useful bridge between the property ledger and the investment dashboard. The model should show NOI by property, period, and portfolio, with the ability to investigate the components behind changes.
Capitalization rate is another central measure. It is commonly calculated as NOI divided by property value or purchase price, depending on the analytical purpose. The metric can help compare income-producing assets, but it should not be interpreted in isolation because cap rates reflect differences in risk, location, property quality, growth expectations, and market conditions. A BI template should therefore show the underlying NOI and value alongside the cap rate so users can understand why the metric changes.
Cash-on-cash return focuses on cash generated relative to invested equity, while IRR considers the timing of investment cash flows. Equity multiple provides another perspective by comparing total distributions and proceeds with invested capital. These measures answer different questions. A dashboard should avoid presenting one as a universal measure of investment quality and instead show a balanced group of operating, cash-flow, leverage, and return metrics.
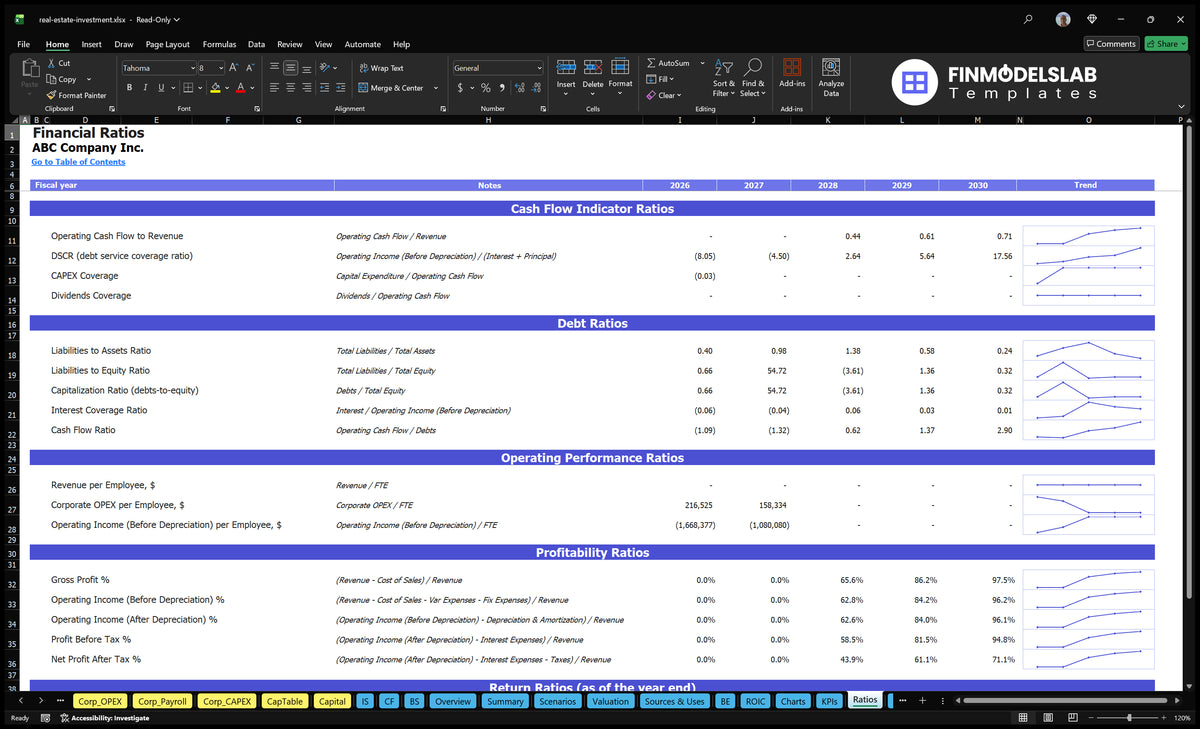
For debt, useful indicators include loan-to-value, debt service coverage ratio, debt yield where relevant, interest rate, remaining balance, and maturity date. These measures show how much financing supports the portfolio and how sensitive the investment may be to changes in interest expense or property value. The dashboard should make it possible to move from a portfolio debt metric to the individual properties responsible for the exposure.
Liquidity is another area that deserves explicit attention. A property can have attractive long-term returns while producing weak short-term cash flow. Tracking beginning cash, operating cash flow, investing cash flow, financing cash flow, distributions, and ending cash helps reveal funding pressure. A dashboard that shows only property values and ROI can hide this issue, whereas a cash-flow view makes the timing of capital requirements visible.
Designing the dashboard layer
The first dashboard page should be an executive overview rather than a dense financial workbook. A practical layout can place portfolio value, NOI, cash flow, occupancy, leverage, and return measures across the top. Below those cards, trend charts can show NOI, rent, operating expenses, property value, and cash flow over time. A property ranking can then identify the strongest and weakest assets according to selected metrics.
Filters should be meaningful rather than decorative. Useful dimensions include property, property type, geography, ownership entity, acquisition year, operating status, and reporting period. An investor should be able to select one property and immediately see its revenue, expenses, NOI, debt, valuation, cash flow, and returns without losing the ability to return to the portfolio view.
Color should communicate status rather than simply make the dashboard attractive. For example, a neutral base can be used for ordinary results, while clearly defined signals can identify a declining metric, a breached target, or a missing data point. Thresholds should be documented because a red or green indicator without an explicit definition can create false confidence.
A second page can focus on operating performance. It should compare rent, occupancy, concessions, expenses, and NOI by property and over time. This is especially valuable for asset managers because a portfolio-level average may conceal a weak asset. A property-level view lets the user distinguish between a portfolio-wide trend and an issue isolated to one building or operating region.
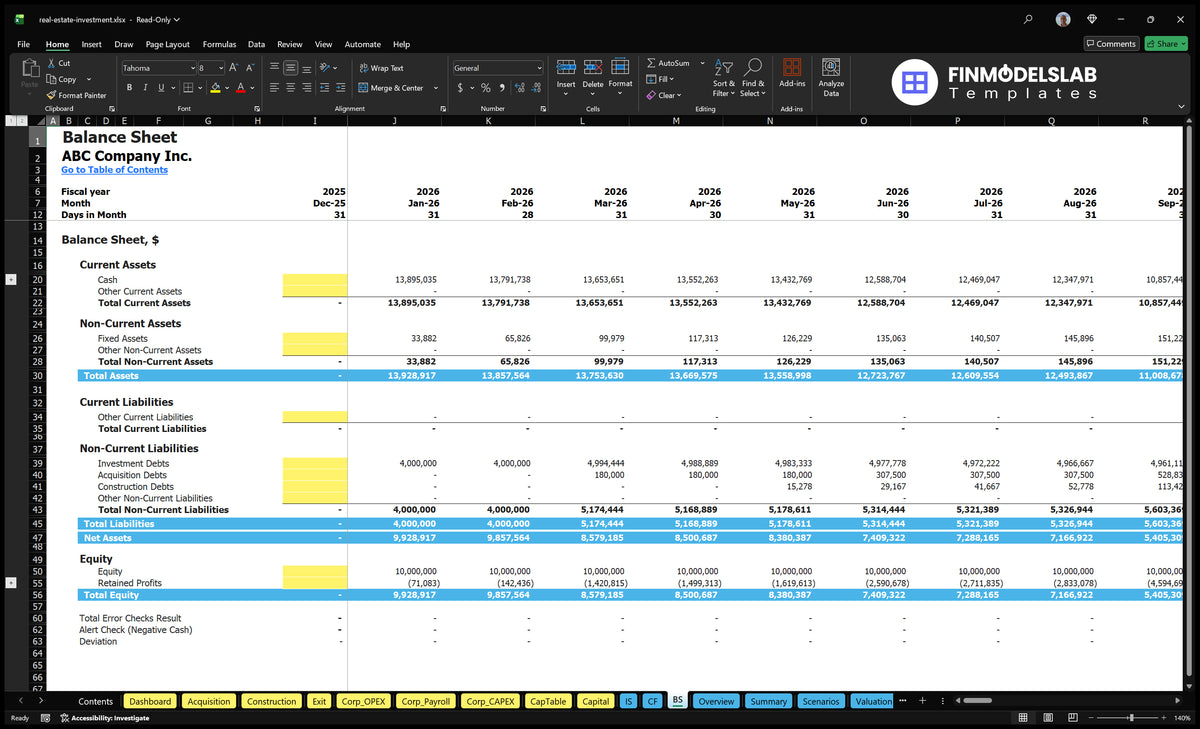
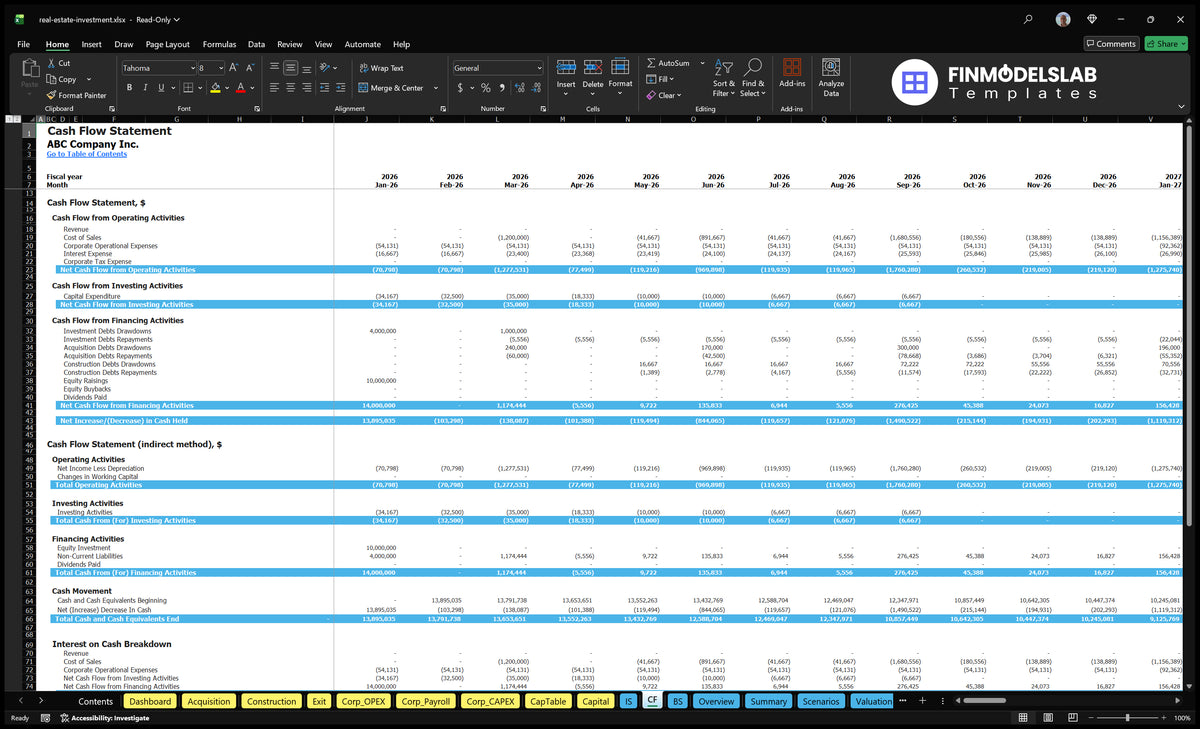
A third page should address cash flow and financing. It can display operating cash flow, capital spending, debt service, refinancing events, distributions, and ending liquidity. The purpose is to help investors understand not just whether a property earns money, but when money enters and leaves the investment. This distinction becomes increasingly important when multiple acquisitions occur at different times.
Scenario analysis and sensitivity testing
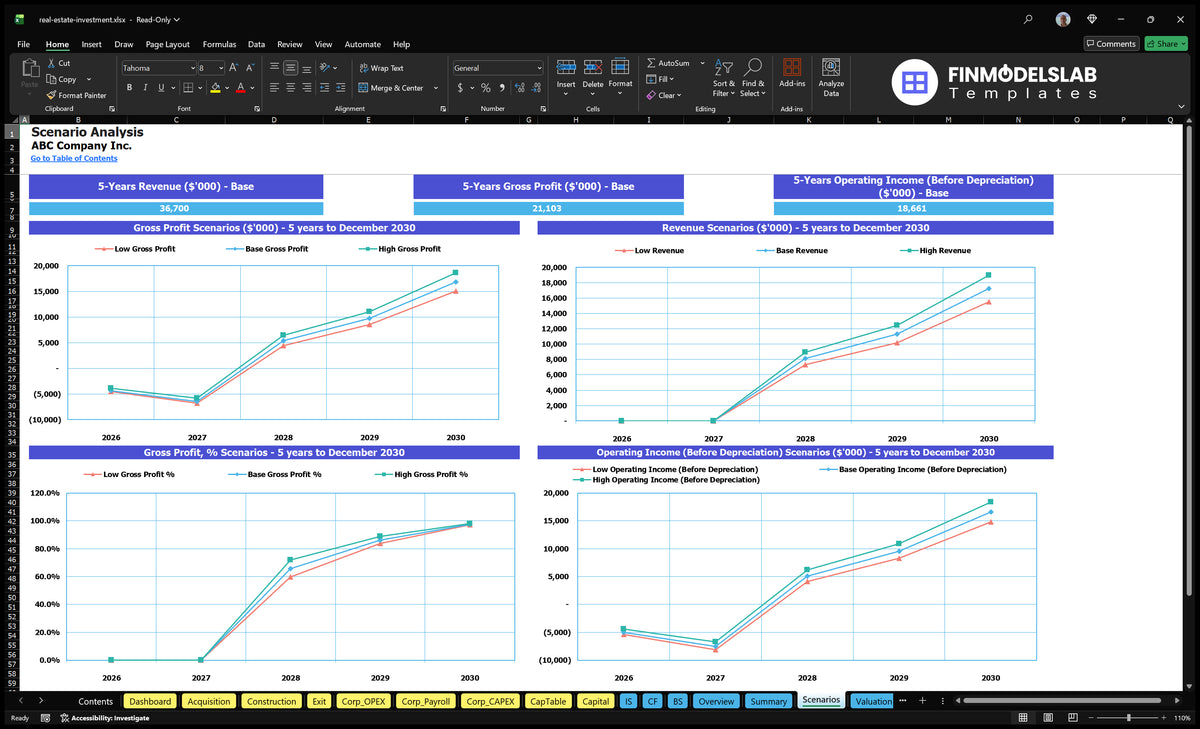
Real estate forecasts are highly dependent on assumptions. Rent growth, occupancy, operating expenses, financing costs, acquisition price, renovation spending, valuation, and exit timing can materially influence results. A BI template should therefore allow users to change selected assumptions and compare the resulting outcomes rather than relying on a single forecast.
A practical scenario structure uses at least three cases such as downside, base, and upside. The cases should change explicit drivers rather than simply applying arbitrary percentage adjustments to the final return. For example, a downside case could combine slower rent growth, higher vacancy, higher operating expenses, and a more conservative exit assumption. The exact assumptions should be based on the investment thesis and available market evidence rather than invented benchmarks.
Sensitivity tables can then identify the assumptions that matter most. An investor might test IRR against purchase price and exit capitalization rate, or cash flow against occupancy and rent growth. The value of the analysis is not the appearance of the chart; it is the ability to see where the investment stops meeting the investor’s target.
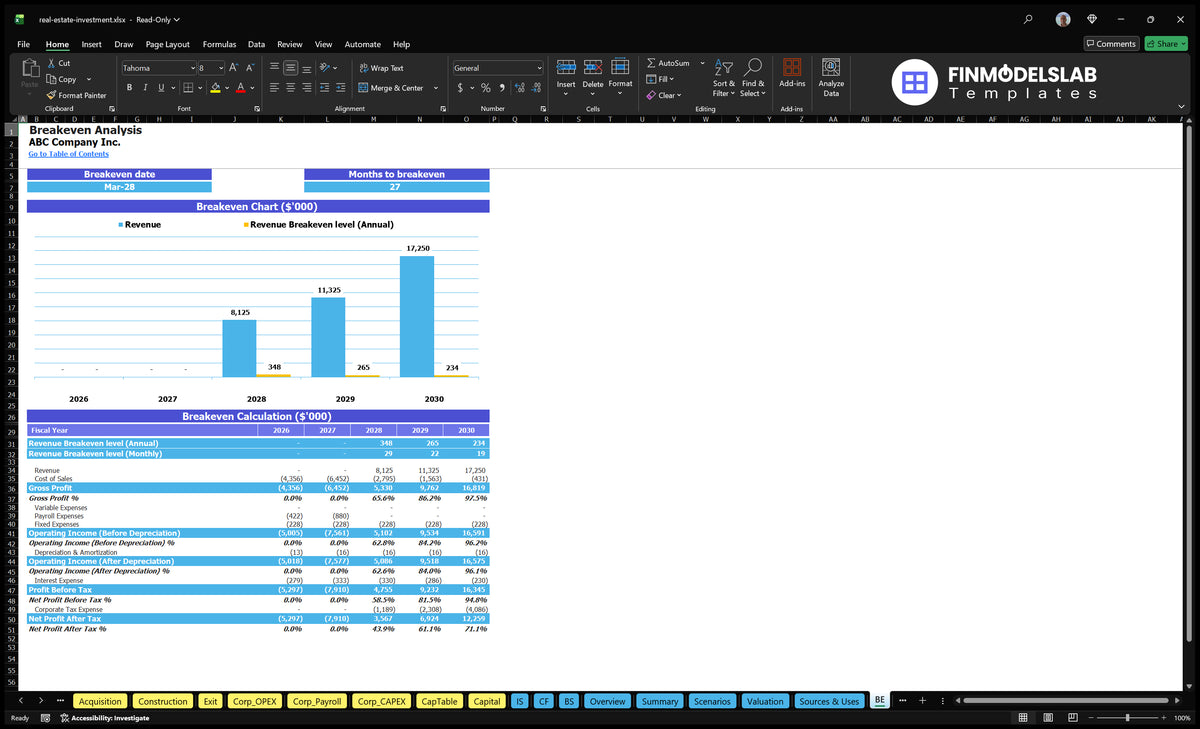
Break-even analysis is particularly useful when evaluating development or value-add investments. It can show when operating income is expected to cover the relevant costs or when cumulative project economics turn positive. The dashboard should distinguish accounting profitability from cash break-even and investment payback because these milestones are not interchangeable.
Valuation, returns, and exit analysis
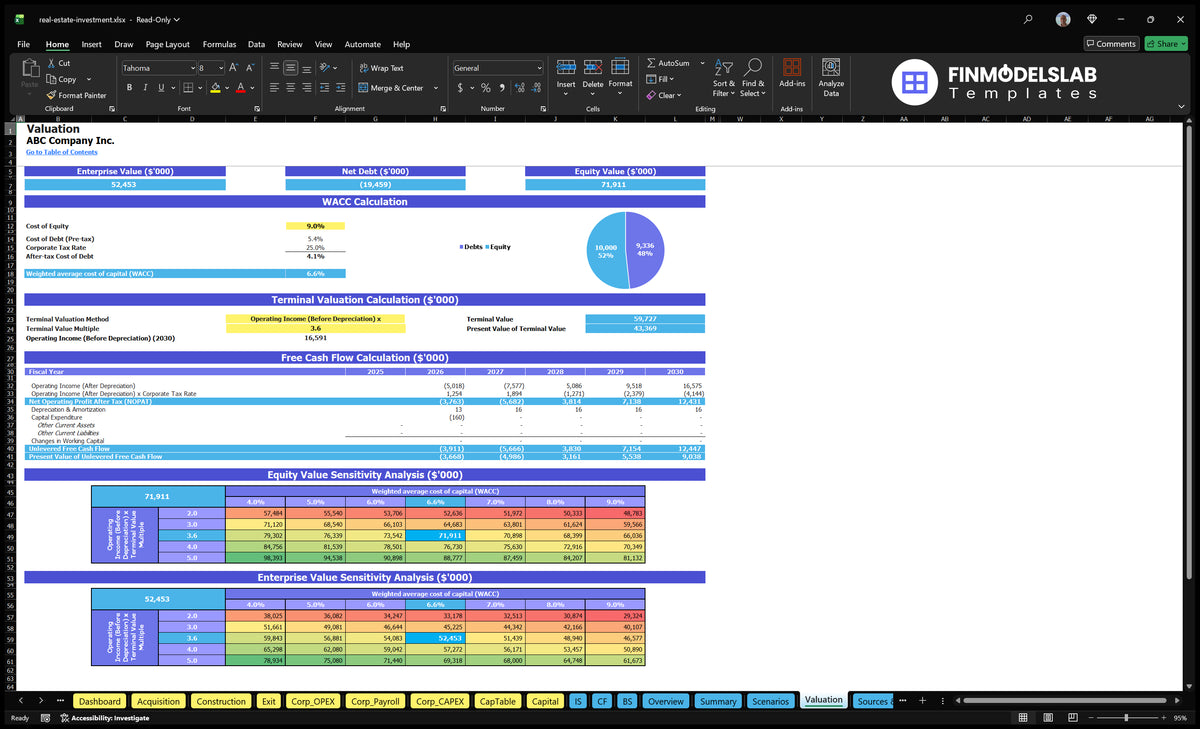
Valuation should connect the assumptions in the operating model with the investor’s view of asset worth. Income capitalization can be useful for stabilized properties, while discounted cash flow analysis can provide a framework for investments where cash flows change materially over time. A BI template can present both approaches when the underlying data supports them, while clearly identifying the assumptions behind each method.
Exit analysis should show more than an estimated sale price. It should include selling costs, outstanding debt, taxes where relevant to the model, and the resulting equity proceeds. The investor can then connect those proceeds to the original equity contribution and interim cash flows. This creates a clearer picture of the actual return path rather than treating appreciation as if it were automatically realized cash.
The return dashboard should also preserve the distinction between levered and unlevered performance. Unlevered metrics show the economics of the property or project before financing, while levered metrics incorporate debt. A property may look attractive on an unlevered basis but become much more sensitive to interest rates or refinancing risk once debt is introduced. Showing both perspectives makes the financing effect easier to understand.
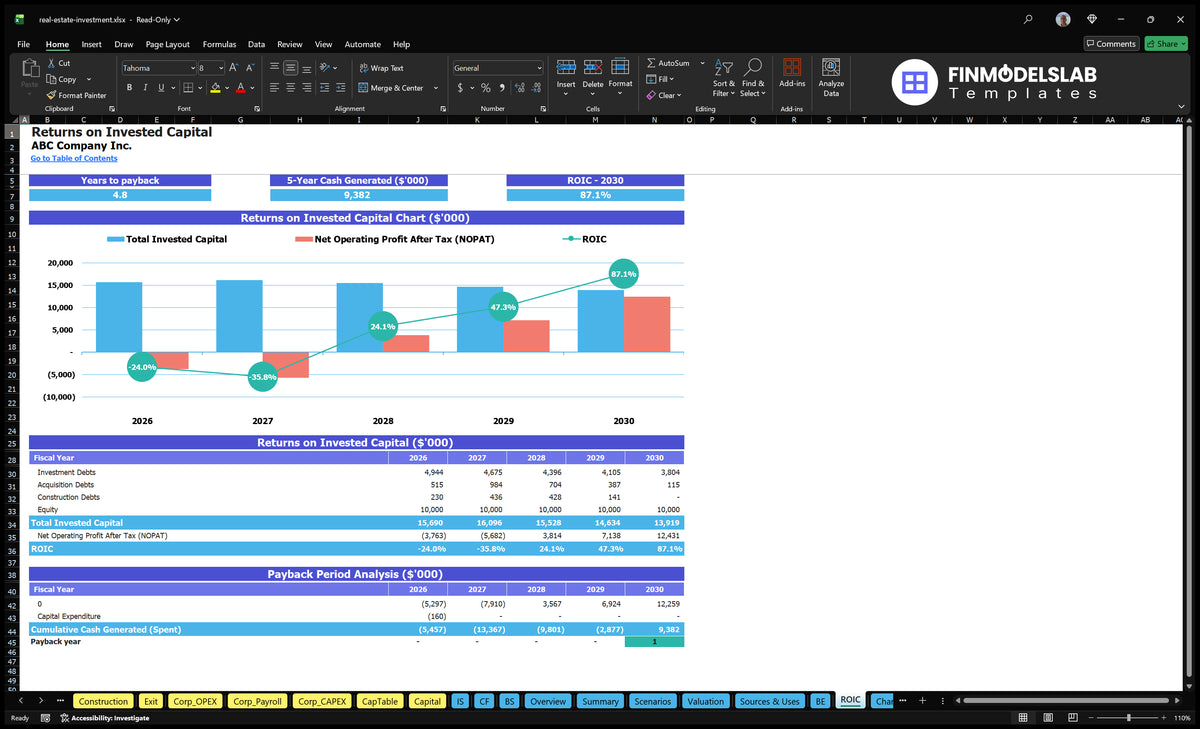
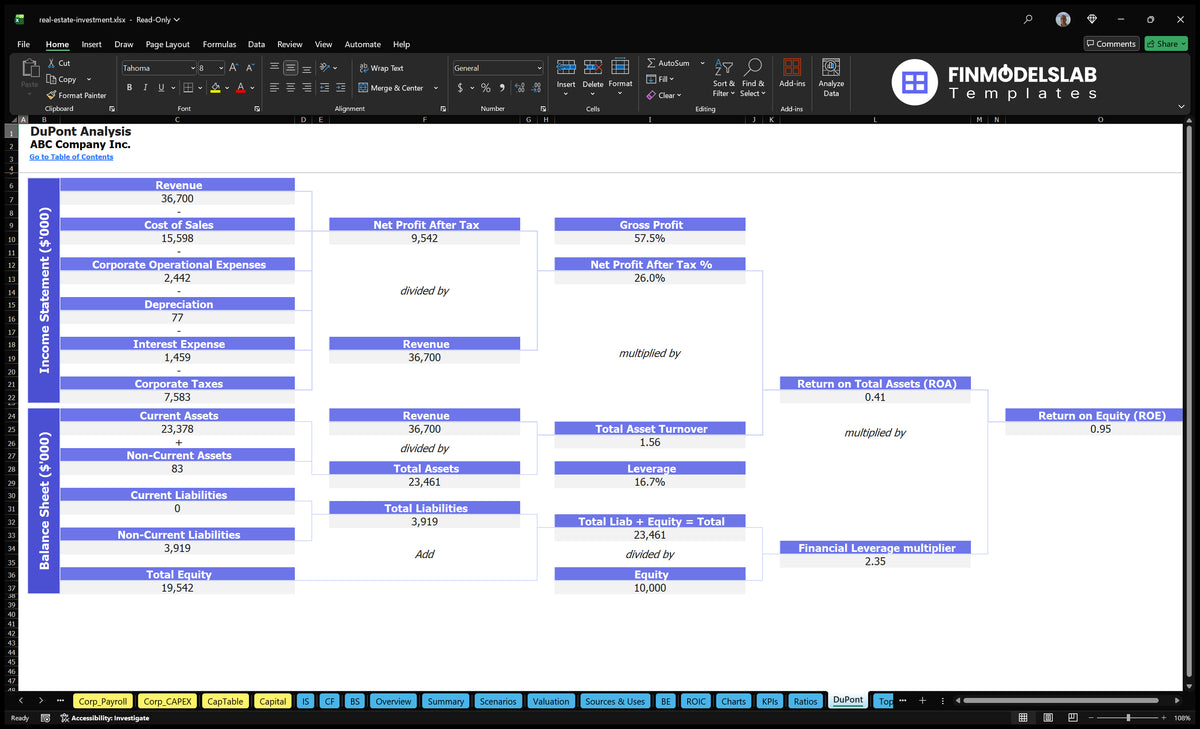
Return on invested capital provides another useful lens because it connects investment capital with operating profit. It can help investors compare capital efficiency across projects, particularly when the projects differ in scale. However, the measure should be interpreted alongside holding period, risk, leverage, and cash-flow timing instead of being treated as a standalone ranking mechanism.
Using Excel, BI tools, and cloud spreadsheets together
An realestate investment bi template excel structure can work well when the financial model itself is the primary calculation engine. Excel remains useful for detailed underwriting because assumptions, formulas, debt schedules, scenario logic, and supporting calculations can be inspected directly. The BI layer can then summarize the model into portfolio dashboards and management reports.
A cloud spreadsheet can be useful when several people need to review assumptions or maintain a shared property register. The key is to preserve a controlled structure. If different users create their own column names, date formats, property identifiers, and calculation methods, the dashboard becomes difficult to maintain. A standardized input schema is therefore more valuable than a complicated visual design.
The phrase realestate investment bi template google sheets reflects a common search intent around collaborative spreadsheet-based analysis. A practical structure should separate raw records, assumptions, calculations, and dashboard outputs into clearly defined sheets. It should also document formulas and refresh procedures so another analyst can understand how the figures were produced.
For a BI platform such as Power BI, the emphasis shifts toward a proper data model. Property, date, transaction, rent, expense, debt, and valuation tables can be related through shared identifiers. Measures can then calculate portfolio totals, period changes, occupancy, NOI, return metrics, and other indicators. This approach is more scalable than building every chart from manually maintained summary cells.
For readers searching for a realestate investment bi template google docs format, it is important to distinguish document presentation from financial calculation. A document editor is useful for investment memoranda, assumptions notes, methodology, and narrative reporting, while numerical calculations are generally better maintained in a structured spreadsheet or BI model. A professional workflow can use the document as the explanatory layer and the data model as the analytical source.
Portfolio monitoring and KPI design
Portfolio monitoring becomes more valuable as the number of properties increases. Instead of reviewing every asset with equal attention, a dashboard can rank properties by NOI growth, occupancy change, cash-flow variance, debt exposure, valuation movement, or return measures. This allows an investor to focus analytical effort where the largest changes or risks are occurring.
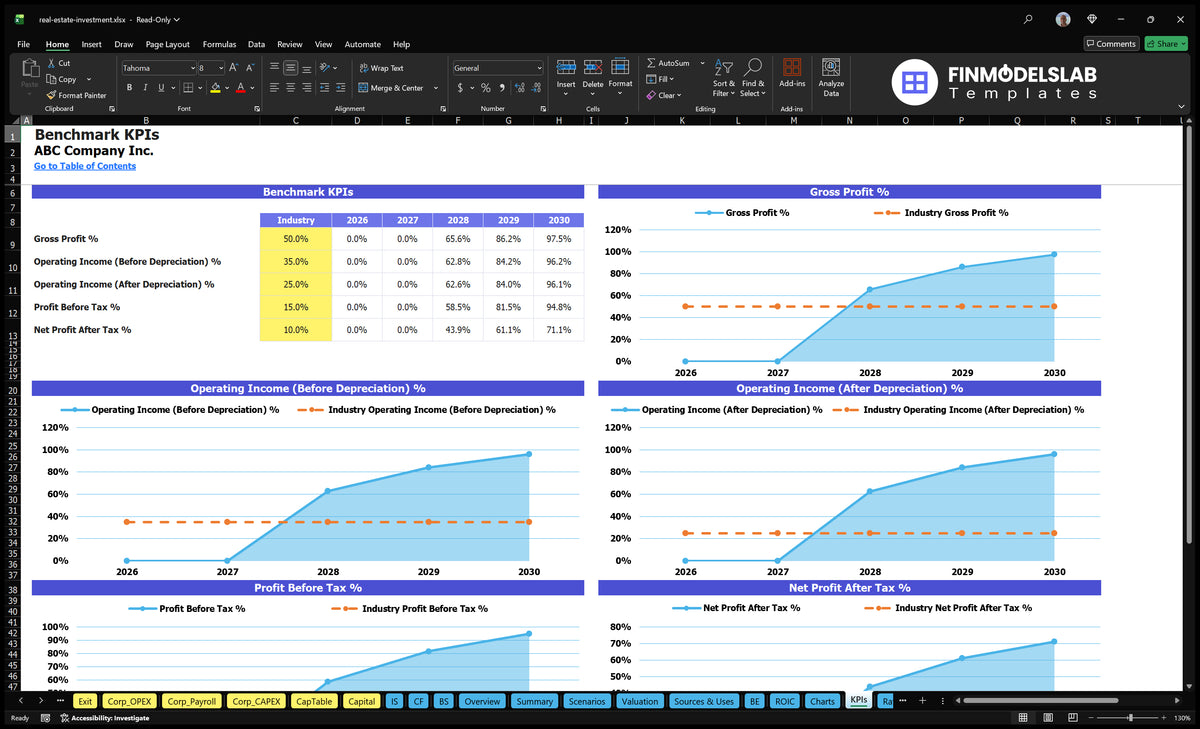
Benchmarking should be carefully defined. Internal benchmarks can compare one property against the portfolio median, prior-year results, acquisition underwriting, or the property’s own budget. External benchmarks may also be useful, but they should be based on comparable markets, asset types, periods, and definitions. A dashboard should never imply that a single threshold is universally appropriate for every property.
Variance analysis is another valuable feature. A budget-versus-actual view can show whether rent, vacancy, repairs, utilities, management costs, capital expenditures, and other categories are tracking as expected. The dashboard can then highlight the largest variances and allow the user to drill into the underlying property or period.
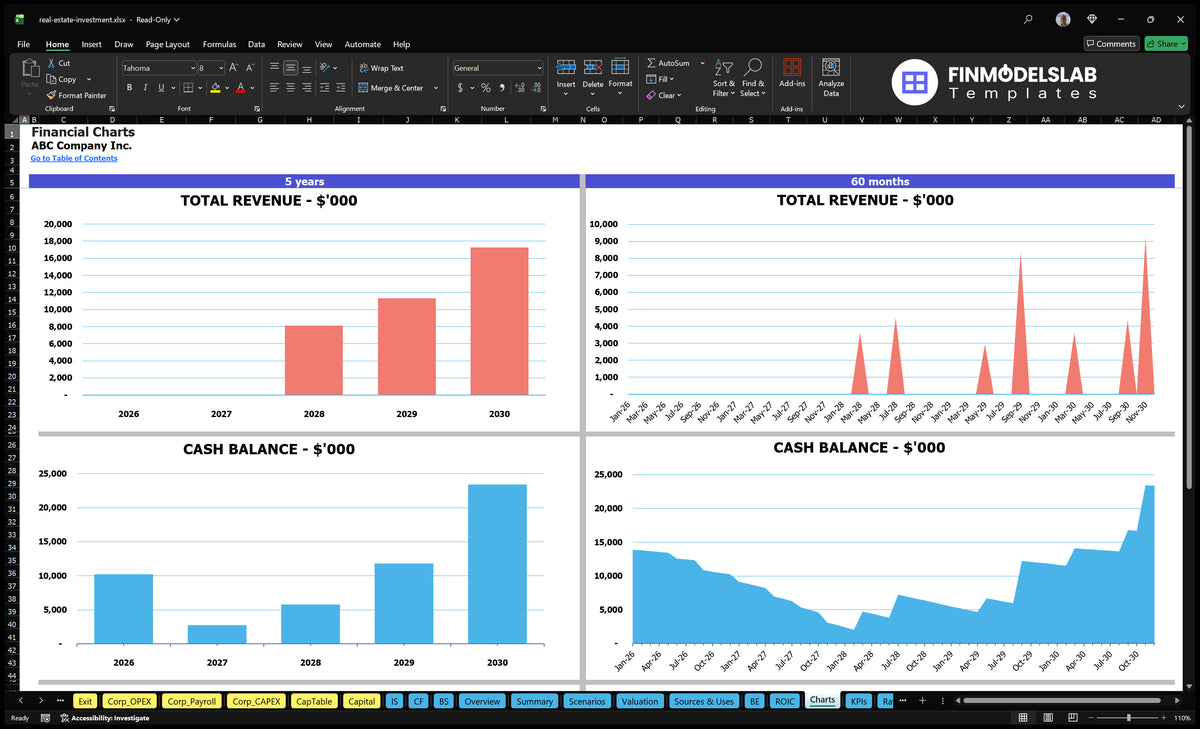
The realestate investment bi template pdf search phrase points to another common requirement: presenting analytical results in a fixed report format. A PDF-style report should emphasize summary metrics, assumptions, major movements, risks, and investment conclusions rather than attempting to reproduce every underlying worksheet. The dashboard should therefore be designed so its most important views remain legible when exported to a static report.
Data quality controls matter as much as the dashboard
A sophisticated dashboard can still produce misleading results if the underlying data is incomplete or inconsistent. Basic controls should check for duplicate property IDs, missing acquisition dates, negative or impossible values, unexpected changes in rent, missing debt balances, and mismatched reporting periods. Data validation should also identify whether a property is active, sold, or not yet acquired so that it is not accidentally included in the wrong portfolio calculation.
Model checks should reconcile major totals. Property-level cash flows should roll into portfolio cash flow. Debt balances should reconcile to financing schedules. Acquisition costs should reconcile to sources and uses. Sale proceeds should reconcile to exit calculations. Dashboard totals should match the underlying calculation layer. These checks make the template more trustworthy and make troubleshooting faster when a result changes unexpectedly.
Documentation should explain definitions as well. For example, the dashboard should state whether occupancy is calculated by units, area, or another measure; whether NOI excludes certain costs; whether current value is an appraisal, market estimate, or modeled value; and whether return measures are levered or unlevered. Clear definitions prevent different users from interpreting the same metric differently.
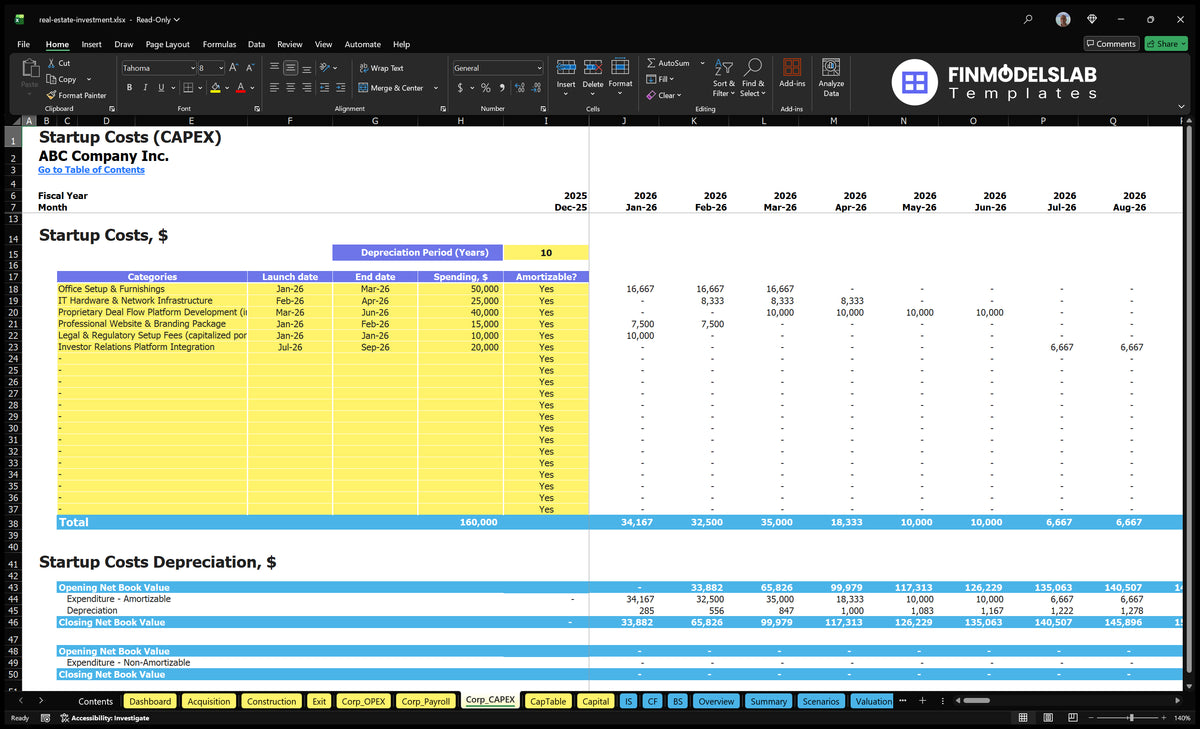
Capital expenditure deserves special treatment because it can be both an investment driver and a cash-flow burden. A BI model should identify planned, committed, and actual capital spending separately where the data supports it. This makes it easier to distinguish recurring maintenance from larger renovation programs and to see how capital requirements affect projected equity returns.
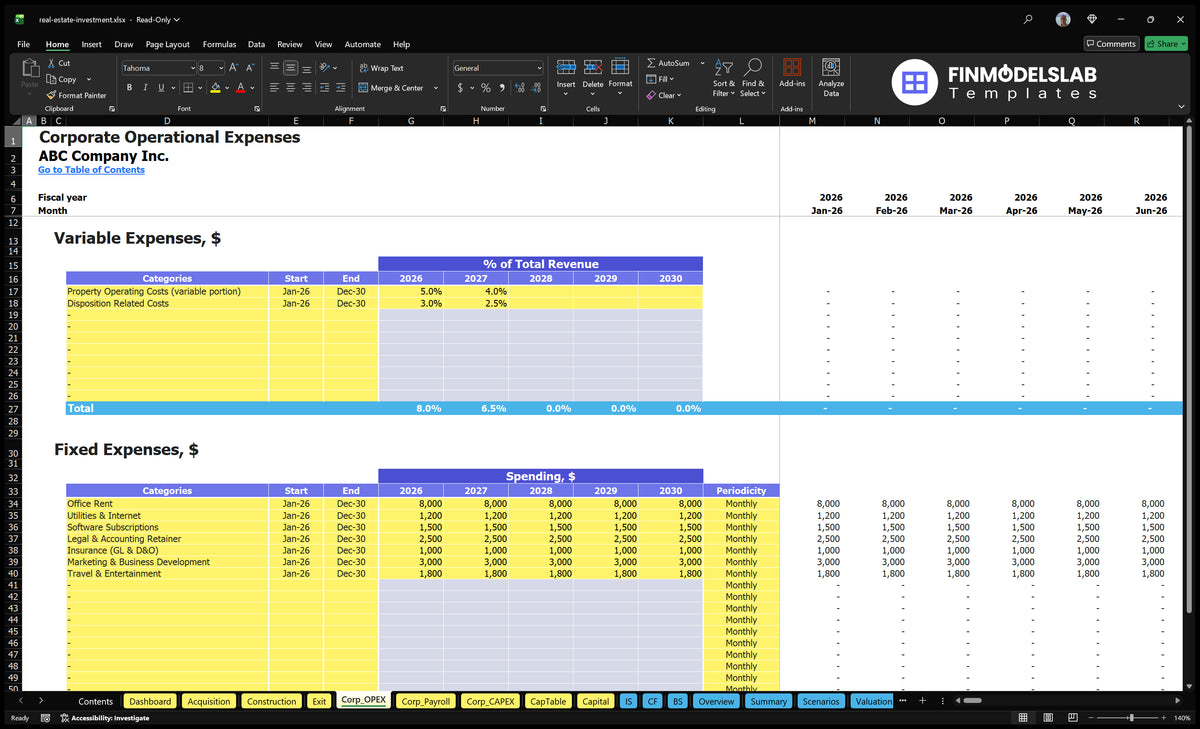
Operating expense analysis should likewise remain granular enough to identify drivers. A portfolio dashboard might show total operating expenses, but an analyst should be able to investigate property taxes, insurance, repairs, management fees, utilities, and other categories. This structure supports better forecasting because unusual movements can be traced to their source rather than being buried in one total expense number.
Investment planning and reporting
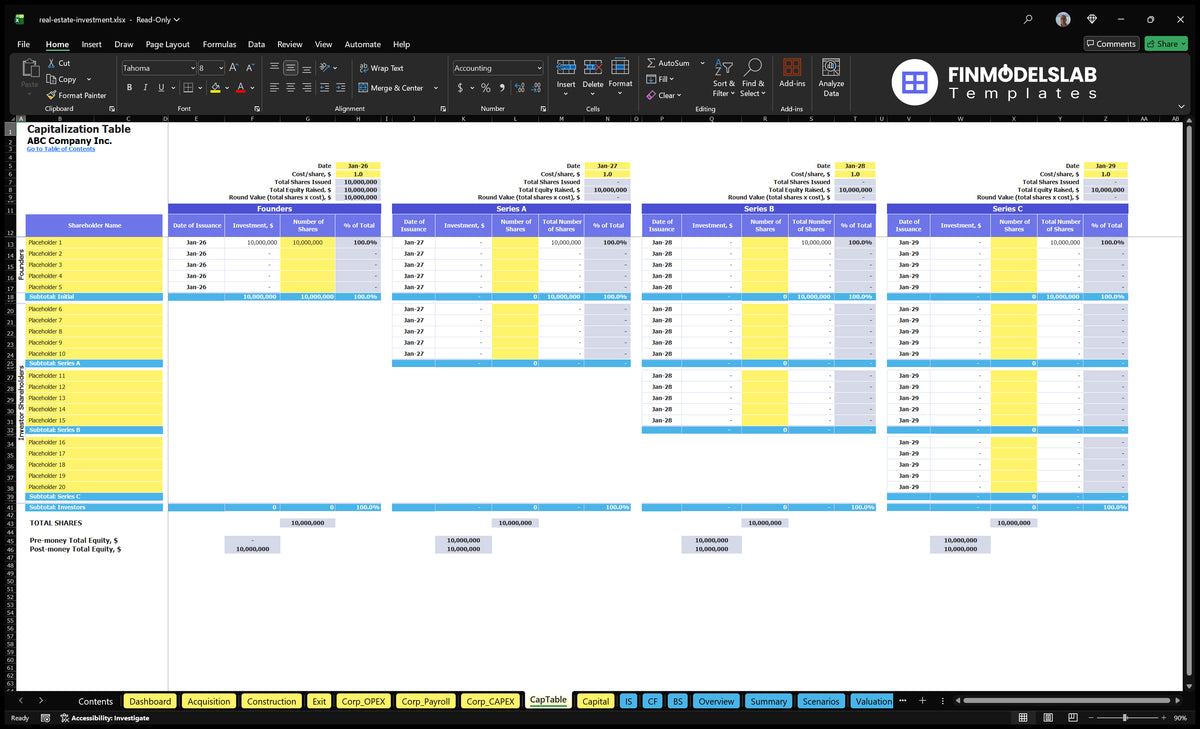
A real estate investment plan template should connect strategy with measurable financial assumptions. The plan can define target property types, acquisition criteria, financing limits, expected holding periods, renovation strategy, income objectives, risk constraints, and exit criteria. The BI dashboard then turns those strategic requirements into measurable indicators that can be reviewed consistently.
A real estate investment business plan template can sit above the financial model and explain the investment thesis, market opportunity, acquisition strategy, operating model, financing approach, risk management, and expected capital requirements. The numerical model should support those statements rather than operate as an unrelated workbook. When the narrative and financial assumptions are linked conceptually, investors can more easily see whether the numbers actually support the proposed strategy.
A reporting pack should be designed for its audience. An owner may want portfolio value, cash flow, equity, returns, and major risks. An asset manager may need rent, occupancy, expense variance, lease information, and property-level NOI. A lender may focus on debt service, leverage, collateral value, and coverage. The same underlying model can support these views if the data architecture is sufficiently structured.
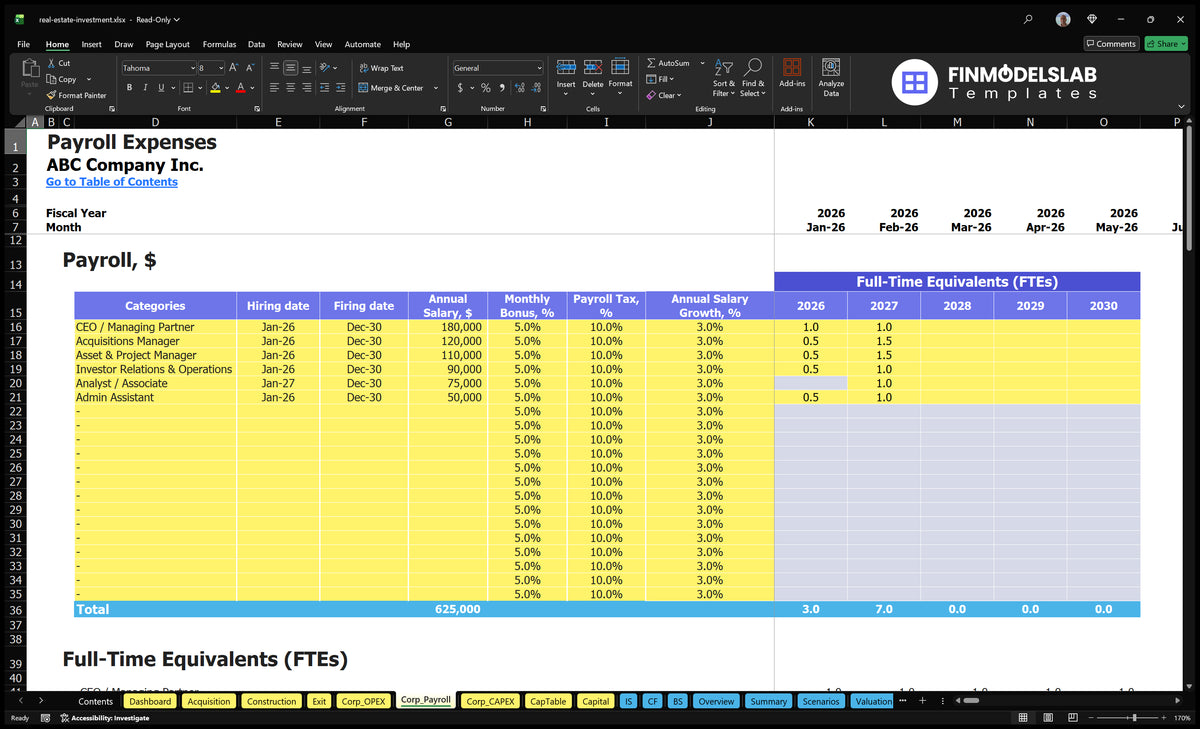
The real estate excel template for investment concept is most useful when the workbook is treated as a controlled analytical model rather than a static form. Inputs should be documented, formulas should remain consistent, and outputs should be connected to the same source assumptions. A well-built workbook can then feed monthly reporting while preserving enough detail for investment review.
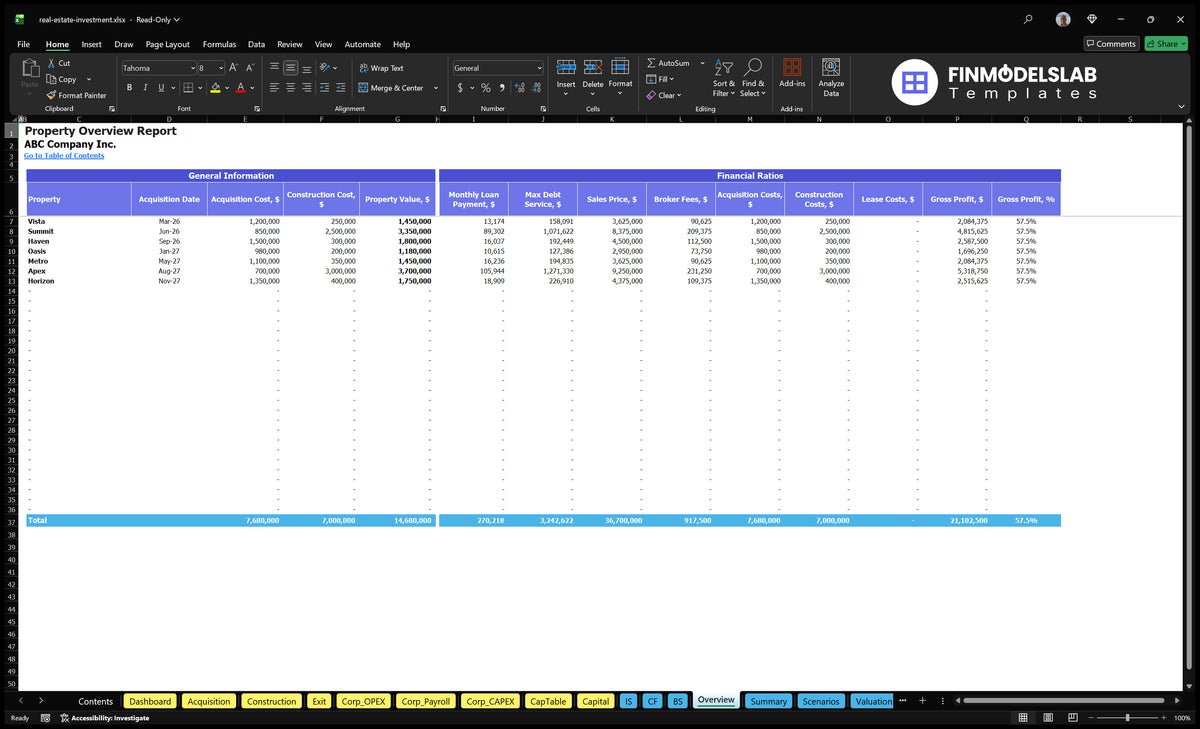
Practical Solution
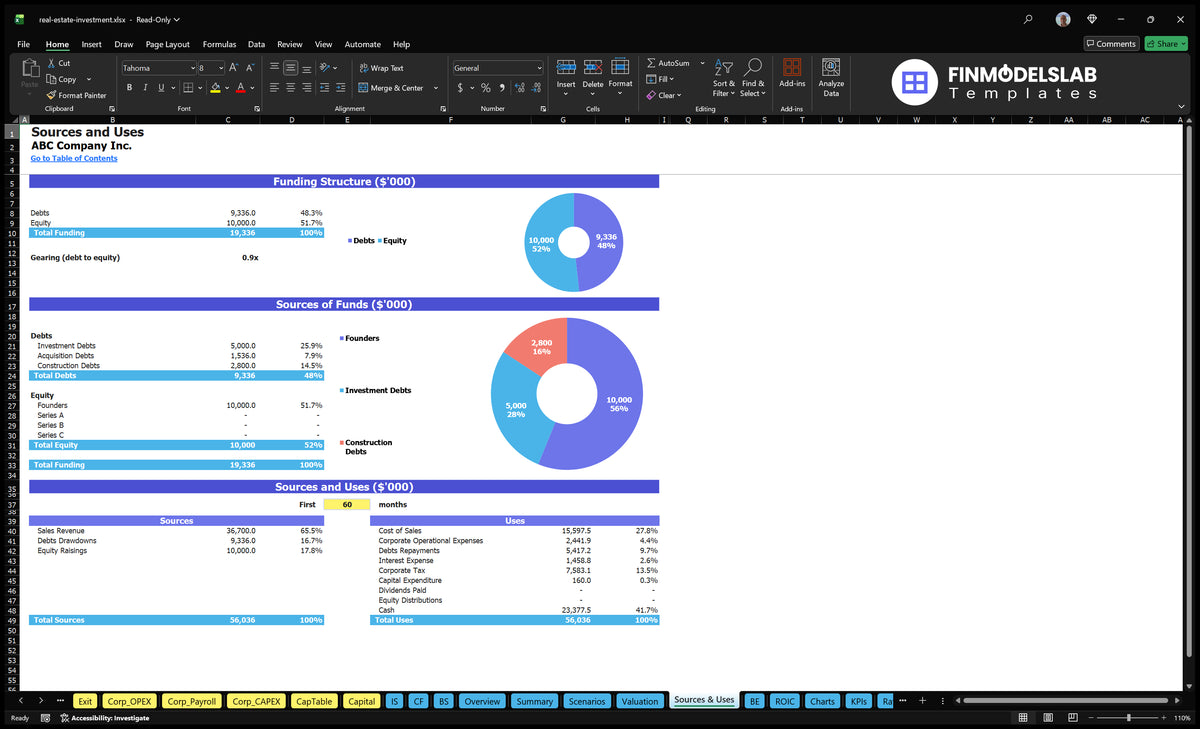
The practical solution is to build the realestate investment bi Template in five connected layers: property data, financial assumptions, calculations, investment metrics, and reporting. Start with a standardized property register and a date dimension. Add transaction, rent, expense, debt, valuation, and capital expenditure records. Then create a controlled assumptions area for purchase price, rent growth, vacancy, operating costs, financing, and exit conditions. Keep calculated fields separate from editable inputs so users know exactly where changes belong.
Next, build the financial calculation layer. Calculate gross potential income, effective income, operating expenses, NOI, debt service, cash flow, equity requirements, property value, sale proceeds, and return measures. Add checks that reconcile property totals to portfolio totals and debt balances to financing schedules. Then create scenario controls for downside, base, and upside cases. Each scenario should change identifiable assumptions so the effect on cash flow, valuation, and returns can be traced.
Finally, build the dashboard around decisions rather than around every available field. Use an executive page for portfolio value, NOI, cash flow, occupancy, leverage, and returns. Add property-level drill-downs for operating performance, a financing view for debt exposure, a valuation view for asset value, and a scenario page for sensitivity analysis. Refresh the data on a defined schedule, document metric definitions, and review unusual changes before relying on the output for an investment decision.
When evaluating existing resources, search terms such as realestate investment bi template reddit can reveal community discussions about modeling practices, but community examples should be treated as reference material rather than authoritative financial guidance. A template should be judged by its formulas, definitions, transparency, data structure, and suitability for the specific investment strategy. The best model is the one whose assumptions can be explained and whose outputs can be independently checked.
The strongest workflow also avoids confusing a visual dashboard with a complete investment model. A dashboard is the reporting layer. It cannot compensate for missing operating data, weak assumptions, incorrect debt calculations, inconsistent property identifiers, or unsupported valuation inputs. The analytical foundation should therefore receive at least as much attention as the presentation layer.
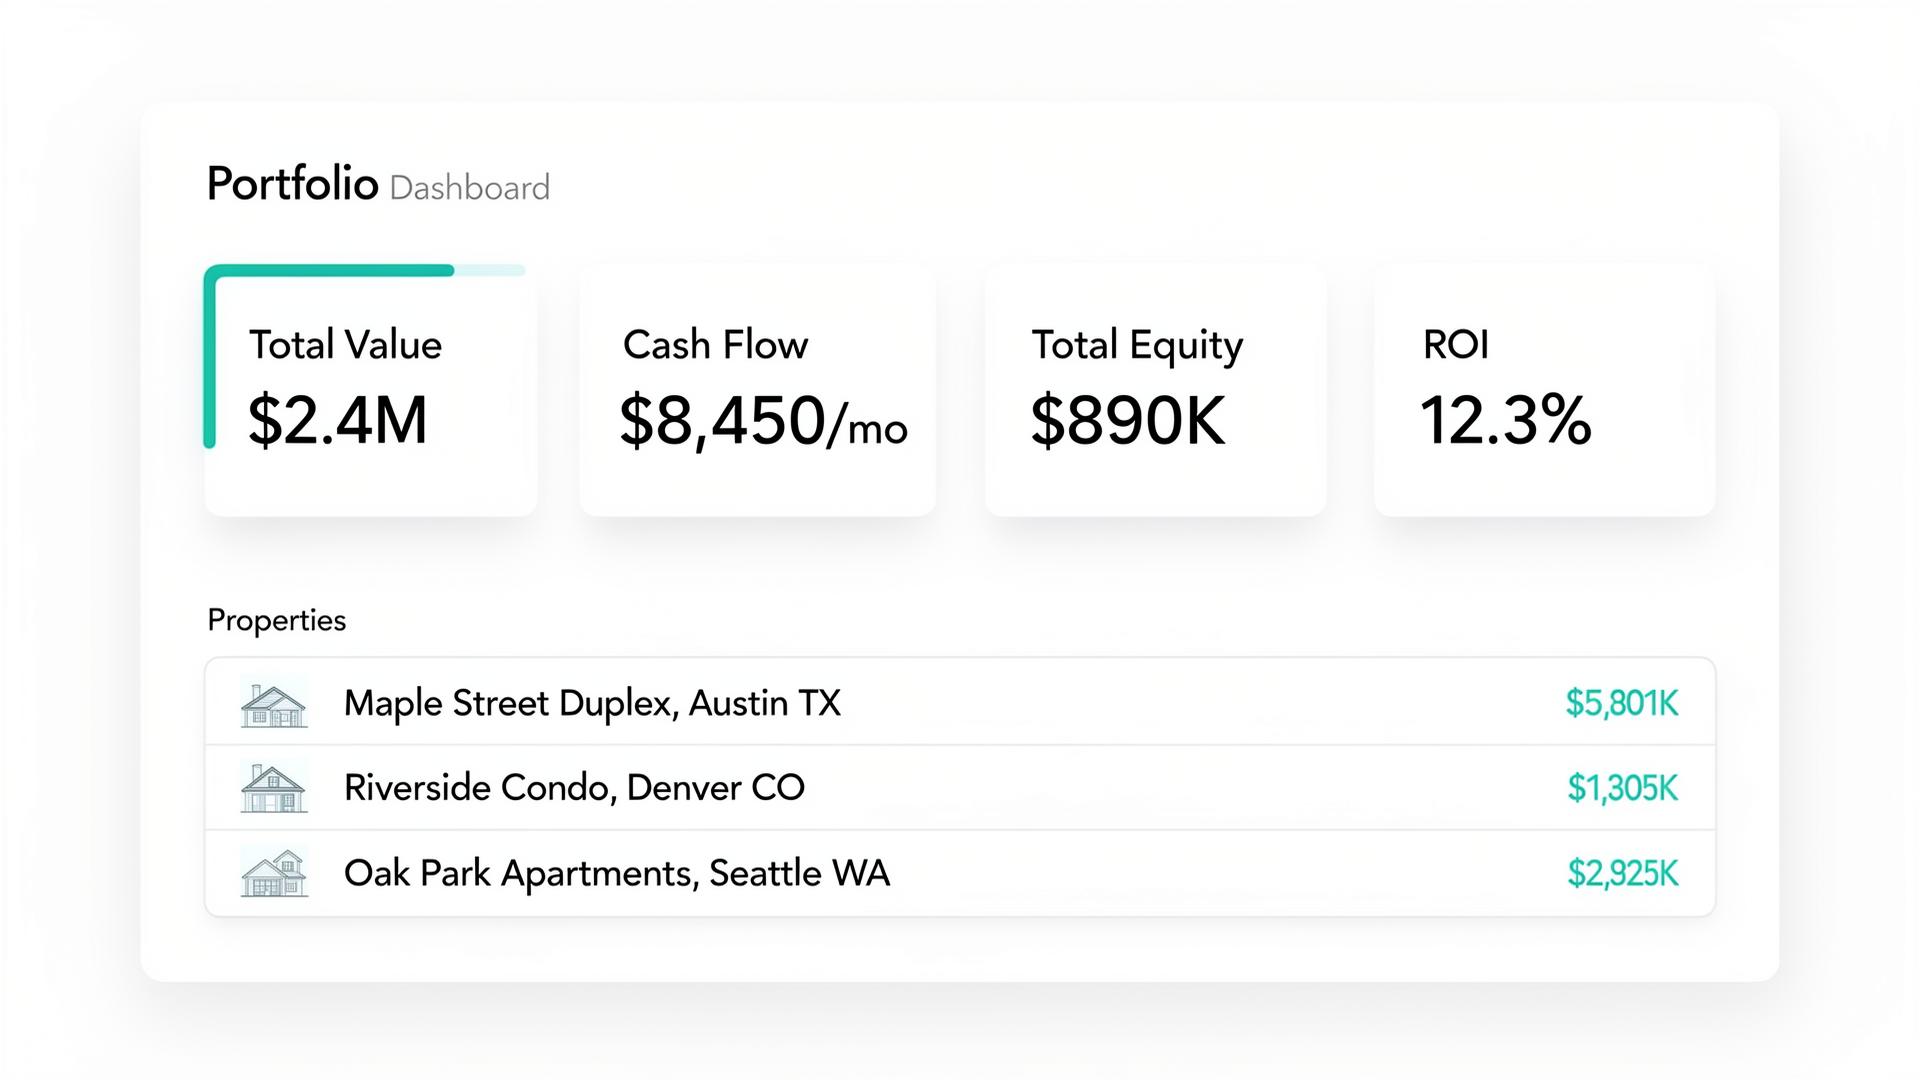
For readers considering an realestate investment bi template excel workflow, the most important design decision is whether the workbook can evolve with the portfolio. A single-property analysis may require only acquisition, rent, expenses, debt, valuation, and exit calculations. A growing portfolio needs standardized property records, period-based transactions, reusable measures, consistent definitions, and stronger reconciliation controls. Designing for that future structure early can prevent a major rebuild later.
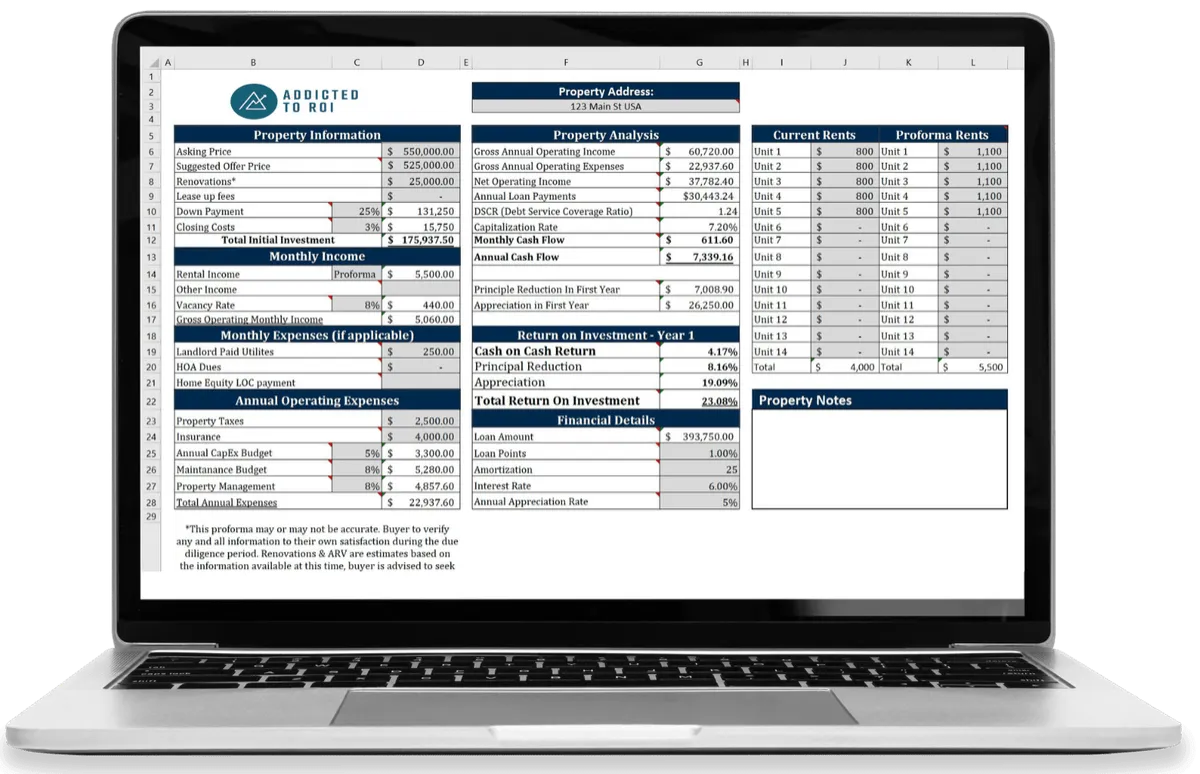
The final review should ask five questions. Are the source records complete? Are the assumptions clearly identified? Do the calculations reconcile? Do the dashboard metrics answer real investment questions? Can another person reproduce the results from the underlying data? If the answer to all five is yes, the template has moved beyond being a collection of spreadsheets and become a practical investment intelligence system.
Reference Examples
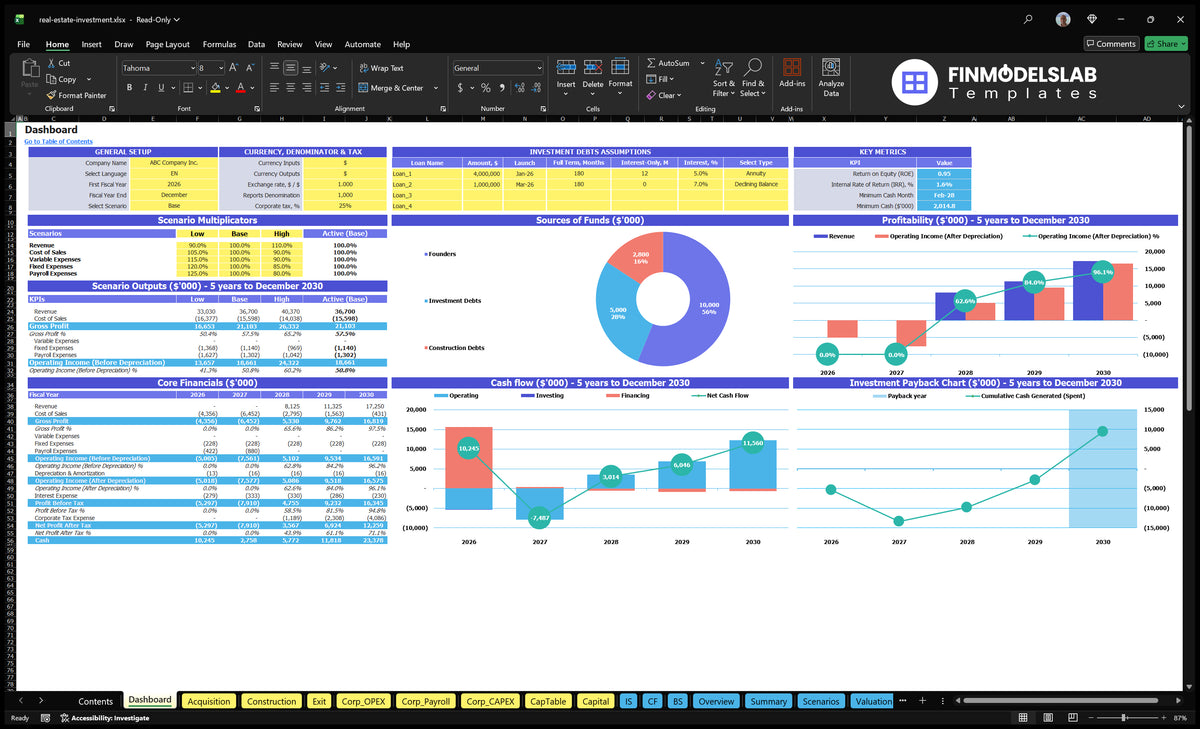
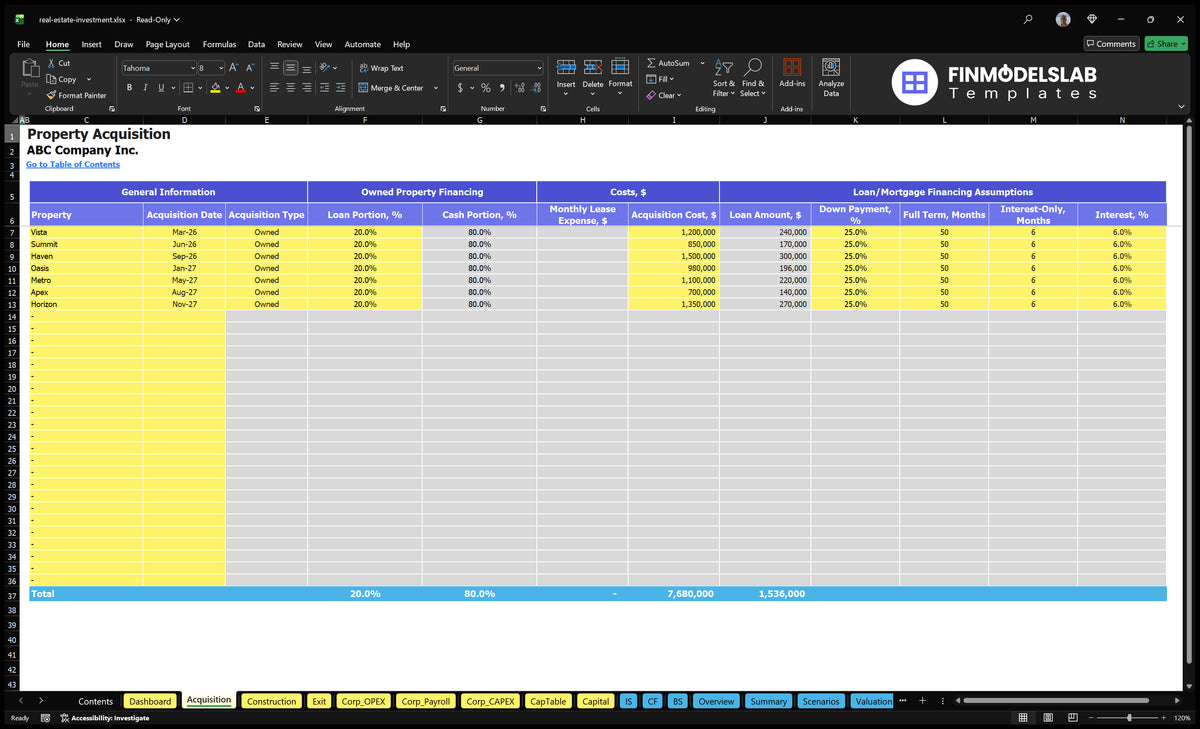
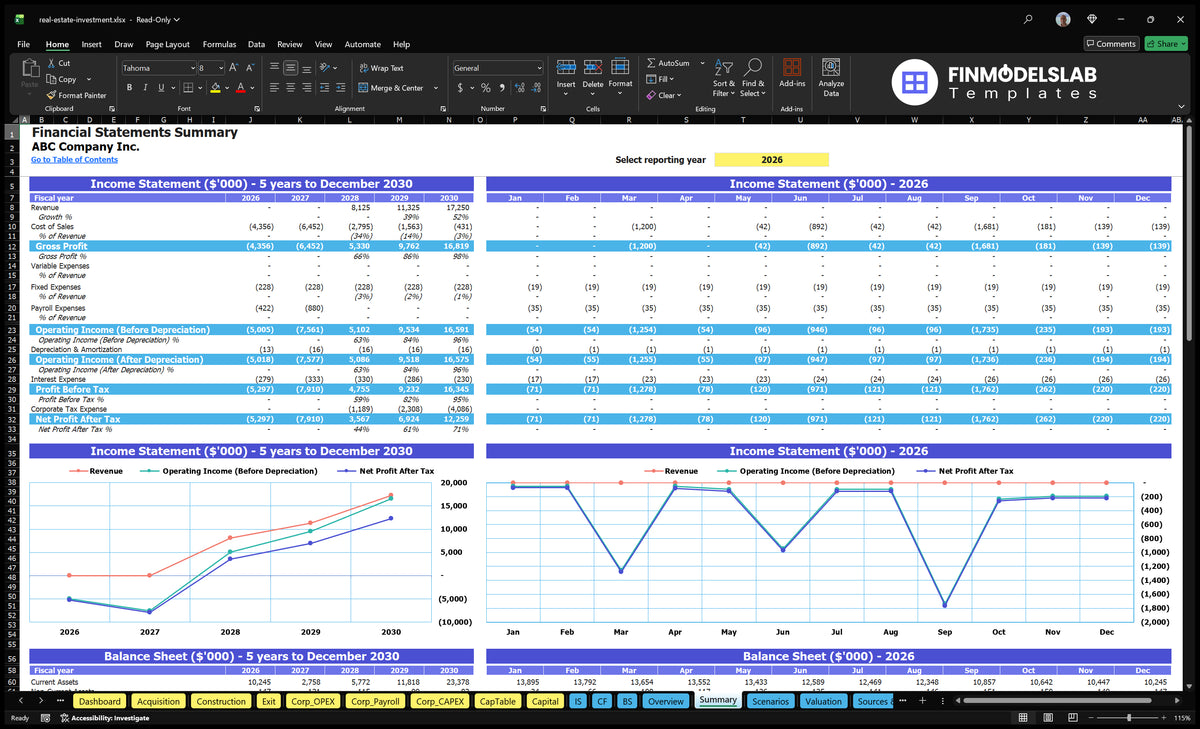
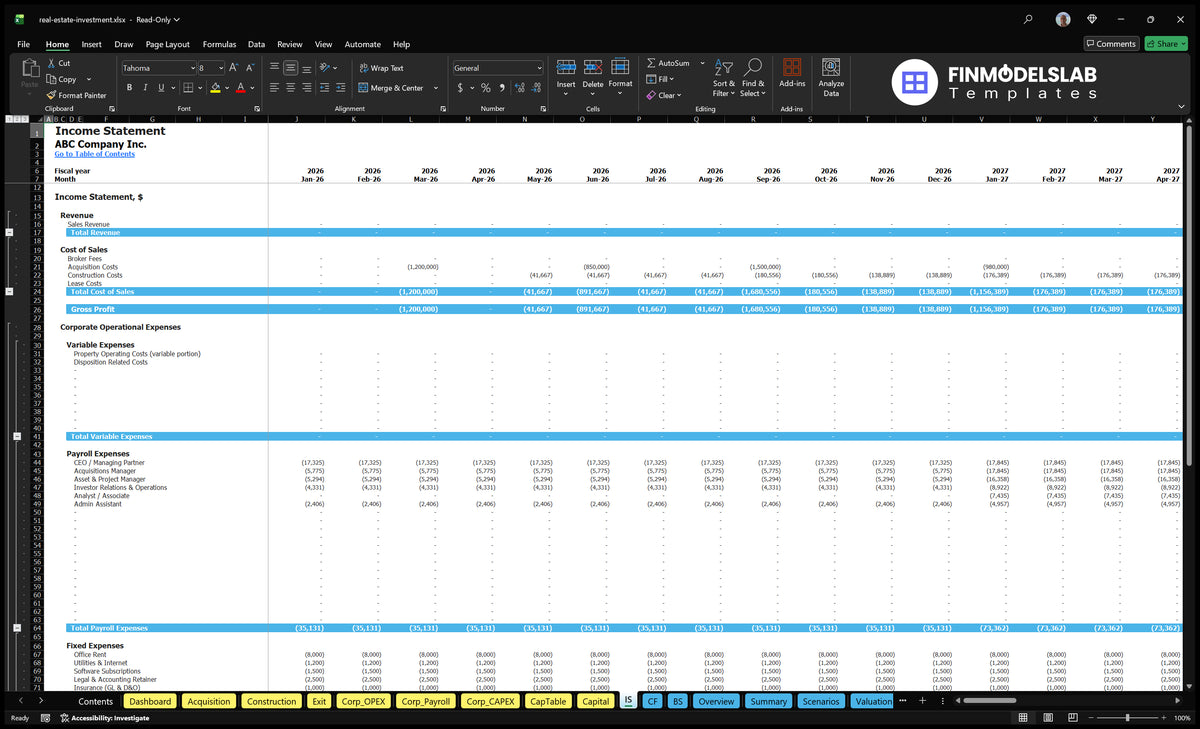
A realestate investment bi Template can take many visual forms, but the strongest examples usually share a common structure: clearly separated assumptions, transparent calculations, portfolio or property-level metrics, and visual outputs that make trends easier to interpret. Useful reference designs include acquisition schedules, scenario analyses, valuation worksheets, return calculations, cash-flow statements, ratio dashboards, and KPI summaries. These examples are valuable because they show how a complex real estate investment model can be organized without forcing every detail onto one screen. They also demonstrate why a good template should connect financial inputs to clearly defined investment outputs.
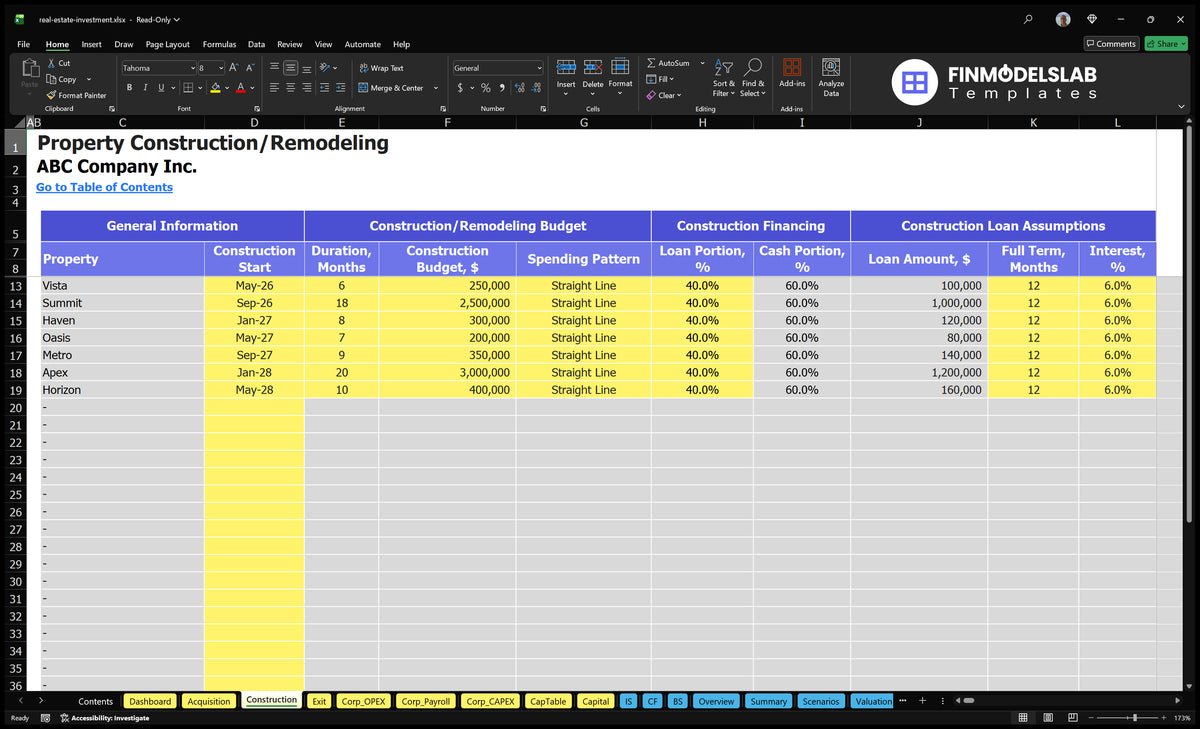
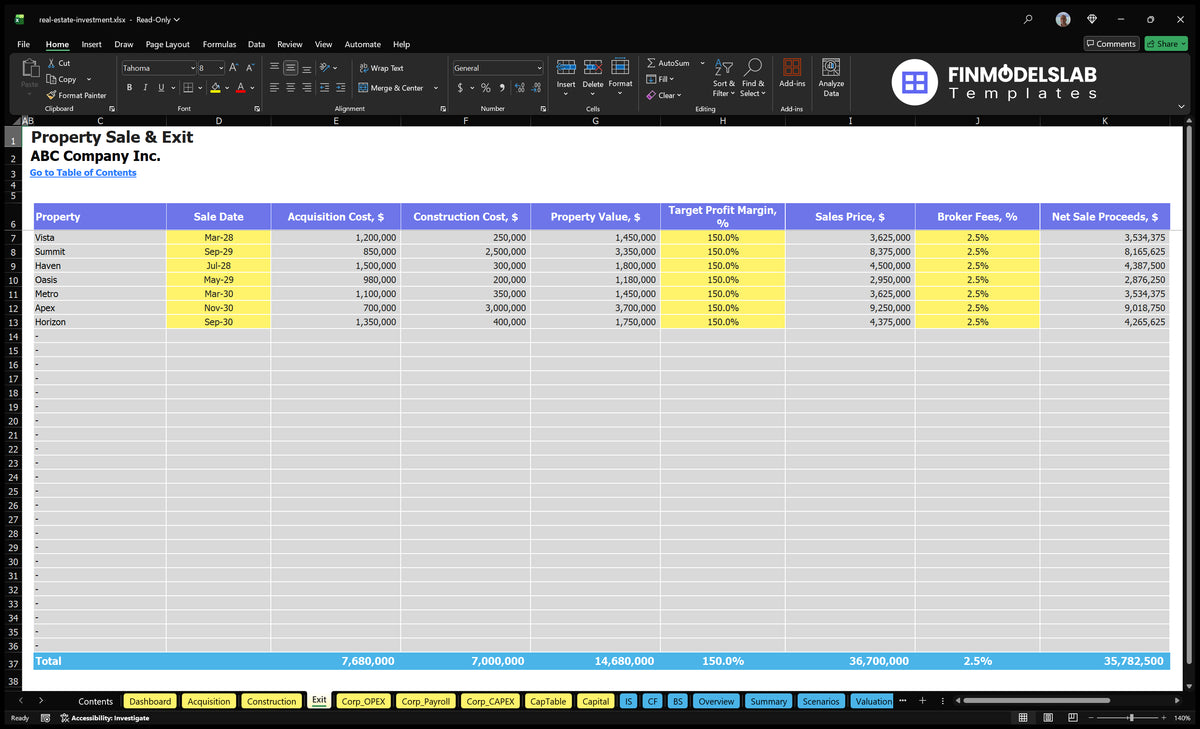
The following visual references illustrate different parts of the realestate investment bi Template concept. Some focus on acquisition and construction assumptions, while others emphasize returns, valuation, cash flow, or operating metrics. They should be viewed as design references rather than universal formulas. Actual investment models need assumptions appropriate to the property type, financing structure, market, tax environment, reporting period, and investment strategy being analyzed. Comparing several layouts can help determine which dashboard structure makes the most important information visible without overwhelming the reader.
Property Acquisition Worksheet
Source: FinancialModelsLab
Property Construction and Remodeling Worksheet
Source: FinancialModelsLab
Property Sale and Exit Worksheet
Source: FinancialModelsLab
Scenario Analysis Worksheet
Source: FinancialModelsLab
Sources and Uses Worksheet
Source: FinancialModelsLab
Cash Flow Statement
Source: FinancialModelsLab
Breakeven Analysis
Source: FinancialModelsLab
Returns on Invested Capital
Source: FinancialModelsLab
Valuation Worksheet
Source: FinancialModelsLab
Financial Ratios Worksheet
Source: FinancialModelsLab
