A marketing trade show expense report Template gives a marketing team a consistent structure for recording the real cost of exhibiting at a trade show. Instead of keeping booth invoices, travel receipts, promotional purchases, shipping charges, service orders, and staff costs in separate places, a well-designed report brings those records into one organized financial view. The goal is not merely to total receipts. A useful report should show what was planned, what was committed, what was actually spent, who owns each cost, and why a variance occurred.
Trade show spending is unusually broad because the financial picture extends beyond booth rental. Common categories include exhibit space, booth construction, graphics, freight, material handling, utilities, internet, labor, travel, lodging, meals, promotional materials, sponsorships, lead capture, and post-show follow-up. Current trade show budgeting resources consistently organize these costs into categories and compare estimated amounts with actual results, which makes the same structure useful for a marketing expense report.
The strongest format also connects spending to the purpose of the event. If the objective is pipeline generation, the report should make it possible to compare total investment with qualified leads, opportunities, revenue influence, or another agreed performance measure. If the objective is brand exposure, the financial record can be paired with booth traffic, meetings, sponsorship exposure, or other campaign metrics. This turns an expense document into a decision-making record for the next show.

What a Trade Show Expense Report Should Accomplish
A trade show expense report should answer a straightforward question: what did this event really cost the organization? That sounds simple, but the answer can be distorted when direct invoices are separated from staff reimbursements, shipping bills, booth services, promotional purchases, or late charges. A structured report reduces that problem by giving every financial item a category, description, amount, owner, date, and supporting record.
The report should also distinguish between planned and realized spending. A budget created before the event is a forecast, while the expense report records what actually occurred. Keeping both views makes variance analysis possible. For example, a booth graphics line may have been estimated at one amount and invoiced at another because the scope changed. Recording both figures preserves the reason behind the difference instead of simply showing a larger final number.
Another important purpose is consistency. When every show uses similar categories, marketing leaders can compare events without rebuilding the financial structure each time. A regional exhibition, national industry conference, and partner event may have very different costs, but the same core fields can still capture booth costs, logistics, personnel, promotion, services, and follow-up. Consistency also makes year-over-year planning more reliable because historical actuals are easier to interpret.

Core Fields to Include in the Template
The first part of the report should identify the event itself. Include the trade show name, organizer, venue, city, event dates, booth number, booth size, reporting period, marketing owner, and internal cost center when those details are relevant to your organization. These fields prevent a receipt from becoming disconnected from the event it supported, particularly when a marketing team attends several shows during the same quarter.
The expense section should use one row per meaningful transaction or committed cost. Useful fields include transaction date, category, vendor, description, payment method, budgeted amount, committed amount, actual amount, variance, owner, receipt status, and notes. A separate reference number can help connect an expense to a purchase order, invoice, card transaction, or reimbursement record.
It is also useful to distinguish between committed and actual amounts. A signed booth contract may create a financial commitment before the final invoice is received. A report that records only paid invoices can therefore make the current financial position look smaller than it really is. Tracking commitment status helps marketing and finance understand obligations before the event is complete.

Recommended Expense Categories
A practical category structure should be detailed enough to expose important costs without becoming so complicated that staff stop using it. A typical trade show structure can include the following groups:
- Booth and space: exhibit space, booth rental, construction, flooring, furniture, graphics, signage, and setup.
- Shipping and material handling: freight, crates, packing, drayage, storage, and return transportation.
- Show services: electrical, internet, cleaning, rigging, security, waste removal, and related venue services.
- Travel and lodging: flights, hotels, ground transportation, mileage, parking, and meals.
- Staffing: temporary staff, training, overtime, uniforms, and other event-specific personnel costs.
- Marketing and promotion: advertising, printed materials, samples, promotional items, sponsorships, and pre-show outreach.
- Lead management: badge scanning, lead capture, data preparation, qualification, and follow-up activity.
- Miscellaneous and contingency: unexpected purchases, replacement materials, rush orders, and other approved costs.
Published trade show worksheets from exhibitors and event specialists use similar groupings, including space, booth construction, shipping, show services, personnel, promotion, lead gathering, and miscellaneous costs. The exact categories should still be adapted to the organization’s chart of accounts and internal reporting rules rather than copied blindly.
Separating Budgeted, Committed, and Actual Costs
The most useful financial reports do more than record a final total. They preserve the difference between the original plan and the amount that ultimately occurred. A simple variance formula is actual cost minus budgeted cost. For cost reporting, a positive result generally means spending exceeded the original budget, while a negative result indicates spending came in below plan. Organizations may choose the opposite sign convention, so the report should clearly define its formula.
Committed spending deserves its own field when a show involves contracts, deposits, service orders, or purchase orders. Imagine that a marketing team budgets 8,000 units of currency for booth construction, has already signed a contract for 7,600, and has paid 4,000 so far. A useful report should not treat the remaining obligation as zero. The three figures tell different parts of the financial story: the approved plan, the amount already committed, and the cash or invoiced amount recorded to date.
This structure also makes early intervention possible. If actual and committed spending together approach the approved limit before major event costs arrive, the team can reconsider optional purchases. Without a commitment field, the warning may not appear until invoices are reconciled after the event. The report therefore becomes a control mechanism rather than merely a historical record.

How to Handle Booth, Design, and Show-Service Costs
Booth-related spending often needs more detail than a single line called “booth.” A better structure separates space rental from physical exhibit costs. Depending on the event, the physical section can include structure, graphics, flooring, furniture, lighting, signage, audiovisual equipment, and installation. This makes it easier to determine whether an overrun came from the venue fee, a design change, added equipment, or labor.
Show services should also be itemized because many costs arrive through separate service orders. Electrical service, internet, cleaning, rigging, material handling, waste removal, security, and installation or dismantling labor can otherwise disappear into a broad miscellaneous category. A detailed worksheet gives each service a visible place and creates a better audit trail when invoices arrive.
Another useful field is the order deadline. Some event organizers offer earlier pricing periods for services, while late orders can carry additional charges. A financial report does not need to assume a particular fee schedule; instead, it can record the quoted amount, deadline, actual invoice, and explanation for any change. This turns historical expense data into planning intelligence for the next event.

Shipping, Drayage, and Logistics Tracking
Shipping should have its own section because freight and material handling can involve several separate transactions. A report may need fields for origin, destination, shipment reference, weight, carrier, inbound cost, material-handling charge, storage, and return cost. Keeping these elements separate helps identify whether the financial difference came from freight, handling, storage, or changes to the shipment itself.
Drayage deserves particular attention because it is distinct from ordinary freight. Freight generally covers transportation to or from the event, while drayage refers to the movement of exhibit materials within the convention logistics process. The exact charging method varies by event and organizer, so the report should use the event’s actual invoice terminology and retain supporting documentation rather than relying on a generic estimate.
For recurring trade shows, logistics history can become extremely valuable. If the same booth travels to several events, the team can compare shipping weight, service charges, packaging choices, storage periods, and return routes. Over time, this may reveal that a lighter exhibit configuration or better shipment timing produces a more predictable cost profile.

Travel, Meals, and Staff Expenses
Travel expenses should be connected to the event rather than mixed into general marketing travel. Useful fields include employee or role, travel date, destination, transportation type, lodging, meals, mileage, parking, and other approved costs. If company policy uses per-diem limits or specific reimbursement rules, those rules should be reflected in the internal process rather than assumed inside the template.
Staff costs can also be separated into direct reimbursement and event labor. A sales representative’s hotel bill is different from temporary booth labor, even though both relate to staffing the show. Keeping them separate gives leadership a clearer view of how much the organization spent on travel versus physical event labor.
For a recurring event, staff-level information can also support planning without becoming overly personal. The report can use role counts or team totals where individual names are unnecessary. This is especially useful when the objective is to compare event economics rather than evaluate individual employees.

Marketing, Promotion, and Lead-Generation Costs
Marketing costs surrounding a trade show can occur before, during, and after the event. Pre-show spending may include digital promotion, direct outreach, creative production, invitations, sponsorship placements, or targeted campaigns. During the show, costs may include printed materials, demonstrations, samples, hospitality, signage, or promotional merchandise. Post-show costs can include lead qualification, sales follow-up, sample shipping, and campaign reporting.
Separating these stages helps determine whether the event was expensive because of the booth itself or because of the surrounding campaign. That distinction matters when planning the next show. A team may discover that a modest booth combined with stronger pre-show targeting performs better for its objectives than a more elaborate physical presence.
Lead-generation spending should also be connected to the quality of the resulting data. A report that records only the cost of lead capture can show spending but not effectiveness. Adding fields for leads captured, qualified leads, meetings, opportunities, and later revenue influence creates a bridge between financial reporting and marketing performance.

Choosing a Spreadsheet or Document Format
Spreadsheet-based reporting is usually useful when the team needs formulas, category totals, variance calculations, filters, and multiple line items. A marketing trade show expense report template excel free search phrase may reflect demand for a spreadsheet structure that can be adapted to internal categories, but the important question is not the label. The important question is whether the format supports accurate totals, clear ownership, and reliable reconciliation.
A shared spreadsheet can work well when several people need to enter expenses and the organization already has a controlled process for financial records. A marketing trade show expense report template google sheets structure can be useful for collaborative editing, while a marketing trade show expense report template google docs format is more suitable when narrative notes, sign-off information, or a printable report is more important than extensive calculations.
For a formal handoff, a marketing trade show expense report template word layout can provide a document-style presentation, while a marketing trade show expense report template pdf structure can be useful for a fixed, print-oriented record. The correct format depends on how the finance and marketing teams exchange information. The same underlying categories should remain consistent even when the presentation format changes.

Building a Report That Finance Can Reconcile
Marketing and finance often look at the same expense from different perspectives. Marketing may care about campaign purpose, event objective, vendor, and performance, while finance may need invoice references, cost centers, payment dates, tax treatment, and account classifications. A strong report includes enough fields to connect those perspectives without forcing one department to replace the other’s system.
The most important control is traceability. Each material expense should be traceable to a source record such as an invoice, receipt, purchase order, card transaction, or approved reimbursement record. The report can include a receipt status field such as “received,” “pending,” or “not required,” depending on internal policy. This helps identify missing documentation before a financial close.
Category naming should also remain stable. If one show records freight under “logistics” and another records it under “shipping,” historical comparisons become harder. Establish a short category dictionary and use it consistently. Subcategories can provide detail without creating dozens of unrelated top-level categories.

Using Variance Analysis to Improve Future Shows
A variance is most useful when the team explains it. A report should therefore include a notes field for significant differences. If freight increased because the booth was heavier than expected, record that reason. If hotel costs were lower because rooms were booked earlier, record that as well. These notes transform numbers into lessons that can be reused during future planning.
Not every variance deserves the same level of attention. A small difference in office supplies may not require investigation, while a major change in booth construction or logistics could materially affect the event’s return. Teams can establish internal thresholds for review, such as a percentage or monetary amount, based on their own financial governance.
Over several events, variance history can become a forecasting resource. Categories that repeatedly exceed estimates deserve more careful planning. Categories that consistently come in below estimates may indicate that the original assumptions are too conservative. The purpose is not to make every event match the first budget exactly; it is to make each subsequent budget more informed.

Connecting Trade Show Expenses to ROI
Expense reporting and ROI reporting are related but should not be treated as identical. The expense report establishes the investment. ROI analysis asks what measurable result came from that investment. Keeping these layers separate makes the financial record easier to audit while still allowing marketing leaders to evaluate performance.
For a hypothetical example, imagine a trade show with an internal approved budget of 40,000 currency units. Suppose final recorded spending reaches 37,500. The expense report should show the actual 37,500 and the 2,500 difference from budget. A separate performance view could then record qualified leads, opportunities, influenced pipeline, and revenue associated with the event. Those figures are illustrative only and should not be presented as industry benchmarks.
A useful trade show report template can therefore contain a financial summary plus a performance summary. The financial side answers where the money went. The performance side answers what the organization received from the investment. Together, they provide stronger evidence for decisions about repeating, expanding, reducing, or changing participation in a particular show.

Common Reporting Mistakes to Avoid
One common mistake is combining every event cost into a single total. A single number may look clean, but it provides little diagnostic value. When the total is higher than expected, the team cannot quickly determine whether the problem came from booth construction, travel, shipping, promotion, or show services. Category-level reporting preserves that insight.
Another mistake is entering actuals only after the event. This turns the report into a historical document rather than a control tool. Updating committed and actual amounts during planning makes it possible to identify financial pressure while decisions can still be changed.
A third mistake is mixing business categories that have different management purposes. A shop expense report template may be suitable for retail operating costs, but a trade show report needs event-specific categories such as exhibit space, drayage, booth services, lead capture, and event promotion. Likewise, a general event expense report template may need additional trade show fields before it can accurately represent exhibition spending.

Practical Solution
Start by creating one master report structure with fixed fields for event details, category, line item, vendor, budget, commitment, actual, variance, owner, documentation status, and notes. Then create the expense categories that reflect your organization’s real trade show workflow. Keep the first version simple enough that a marketer can enter an expense in seconds, but detailed enough that finance can reconcile the result without rebuilding the data.
Next, establish a three-stage workflow. Before the show, enter approved estimates and known commitments from contracts and quotes. During the event cycle, update actual costs as invoices, card charges, and reimbursements arrive. After the event, reconcile every material variance, confirm that documentation is complete, and lock the final event total according to your organization’s financial process.
Finally, create a repeatable review process. Compare actual spending with budget by category, identify the largest unfavorable differences, document their causes, and record practical lessons for the next show. Then compare the final investment with the performance measures that matter to the business. This produces a useful historical record rather than a spreadsheet that is opened once and forgotten.

For teams that want a simple starting point, a report can use the following workflow:
- Define the event: record the show name, dates, venue, booth details, objective, owner, and cost center.
- Build the budget: list every expected category before major commitments are made.
- Record commitments: enter contracts, purchase orders, deposits, and confirmed vendor charges.
- Capture actuals: update invoices, card transactions, reimbursements, and other confirmed costs.
- Reconcile documentation: connect material expenses with receipts, invoices, or other internal records.
- Review variance: investigate material differences and record the reason in the notes field.
- Measure performance: compare the final investment with agreed event outcomes.
- Archive lessons: preserve the final figures and notes as the starting point for the next event.

Practical Fields for a Reusable Reporting Workflow
A reusable report benefits from a clear distinction between descriptive fields and financial fields. Descriptive fields explain what happened: event name, vendor, purchase description, owner, and purpose. Financial fields explain the money: budget, commitment, actual, variance, and payment status. Keeping those functions separate makes the report easier to filter and summarize.
It can also help to include a “phase” field with values such as pre-show, on-site, or post-show. This lets the team identify when spending occurred. A pre-show marketing cost behaves differently from a last-minute on-site service charge, even if the monetary value is similar. Phase reporting can reveal where planning discipline has the greatest effect.
For recurring events, include an “event year” or “show cycle” field. This allows multiple years of historical data to remain in one controlled structure while still permitting each event to have its own summary. The report then becomes a useful reference for forecasting, vendor evaluation, and budget discussions.

Trade Show Expenses Accounting Considerations
Trade show expenses accounting requires more than adding receipts because accounting treatment depends on the organization’s policies, jurisdiction, transaction type, tax rules, and chart of accounts. The expense report should therefore record enough factual information for the responsible finance team to classify transactions correctly, without pretending that one universal accounting treatment applies to every organization.
A practical report can include a finance category or account-code field alongside the marketing category. For example, marketing may classify a cost as “booth graphics,” while finance may assign it to a particular ledger account or cost center. Maintaining both fields avoids forcing marketing categories to serve as accounting codes.
Documentation is especially important for shared or mixed-purpose purchases. If one vendor invoice contains several services, the report should preserve the invoice reference and, where useful, split the amount into the relevant categories. This creates a clearer connection between operational reporting and the underlying financial record.

How to Review the Final Report
The final review should begin with the total actual cost, but it should not end there. Look at the largest categories, the largest variances, and any unusual transactions. Ask whether each major difference has a documented reason. If a category changed because the event scope changed, that is different from an unexplained overspend.
Next, examine the relationship between cost and outcome. If the event produced strong qualified opportunities, the financial result may be interpreted differently from an event that generated little meaningful engagement. The report should not claim causation merely because activity occurred after the show; performance attribution should follow the organization’s established measurement method.
Finally, record three or four concrete planning lessons. These might include changing the booth size, ordering services earlier, reducing shipment weight, adjusting staff count, changing promotional quantities, or strengthening pre-show outreach. The best report does not merely explain the past. It improves the assumptions used for the next event.
Reference Examples
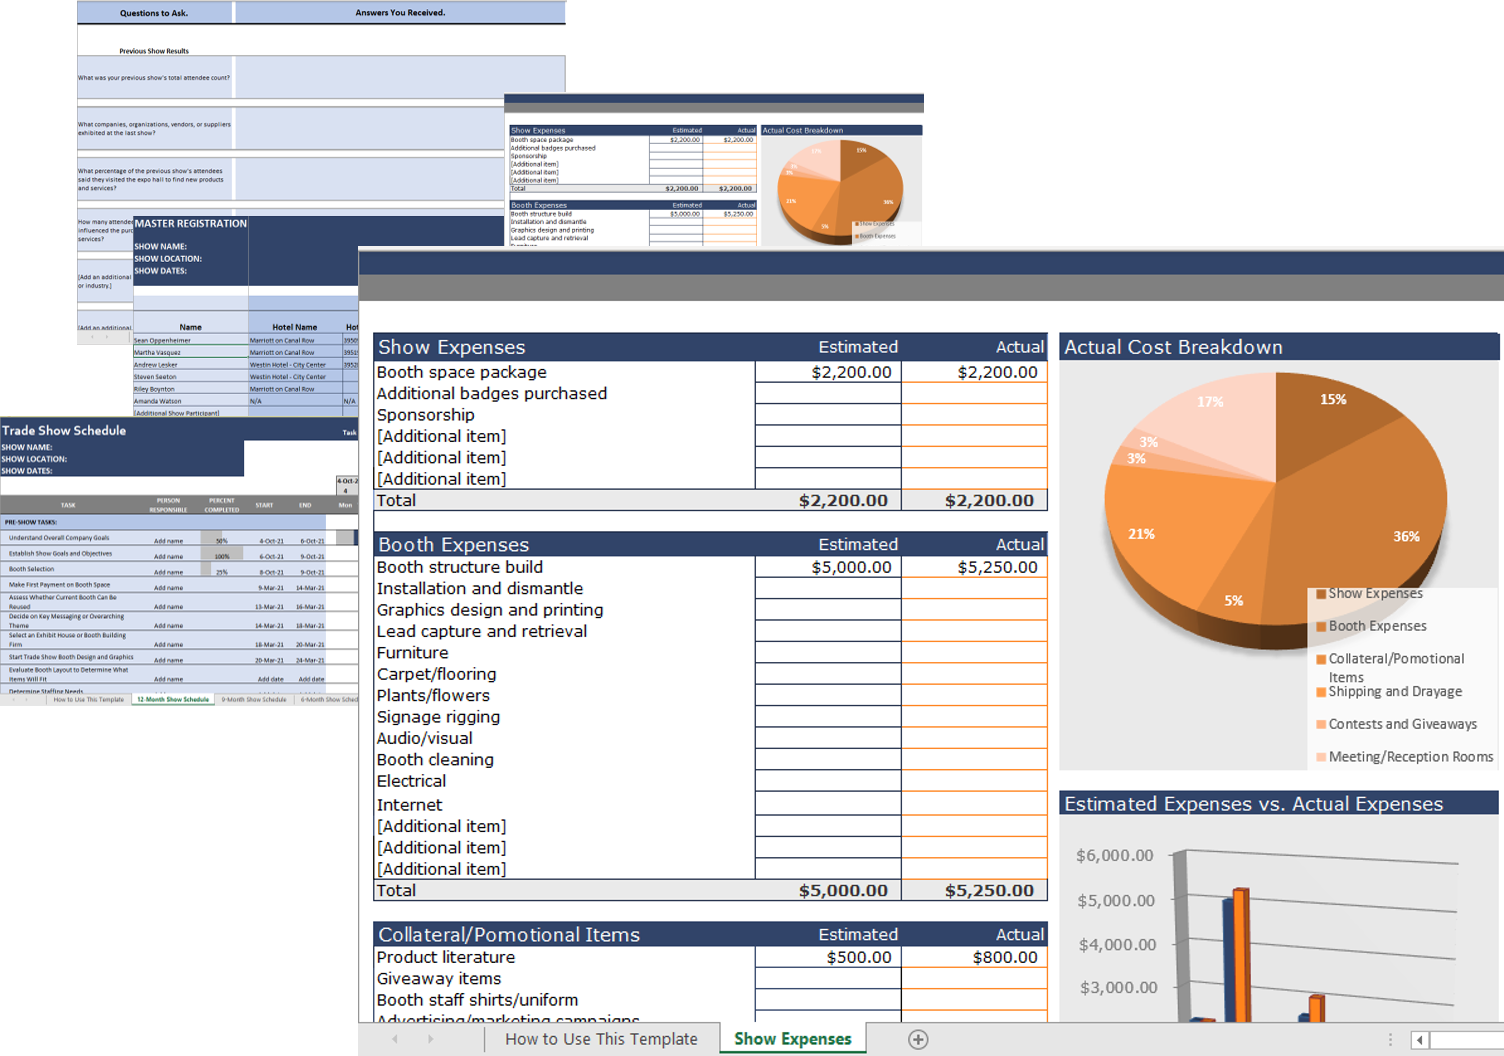
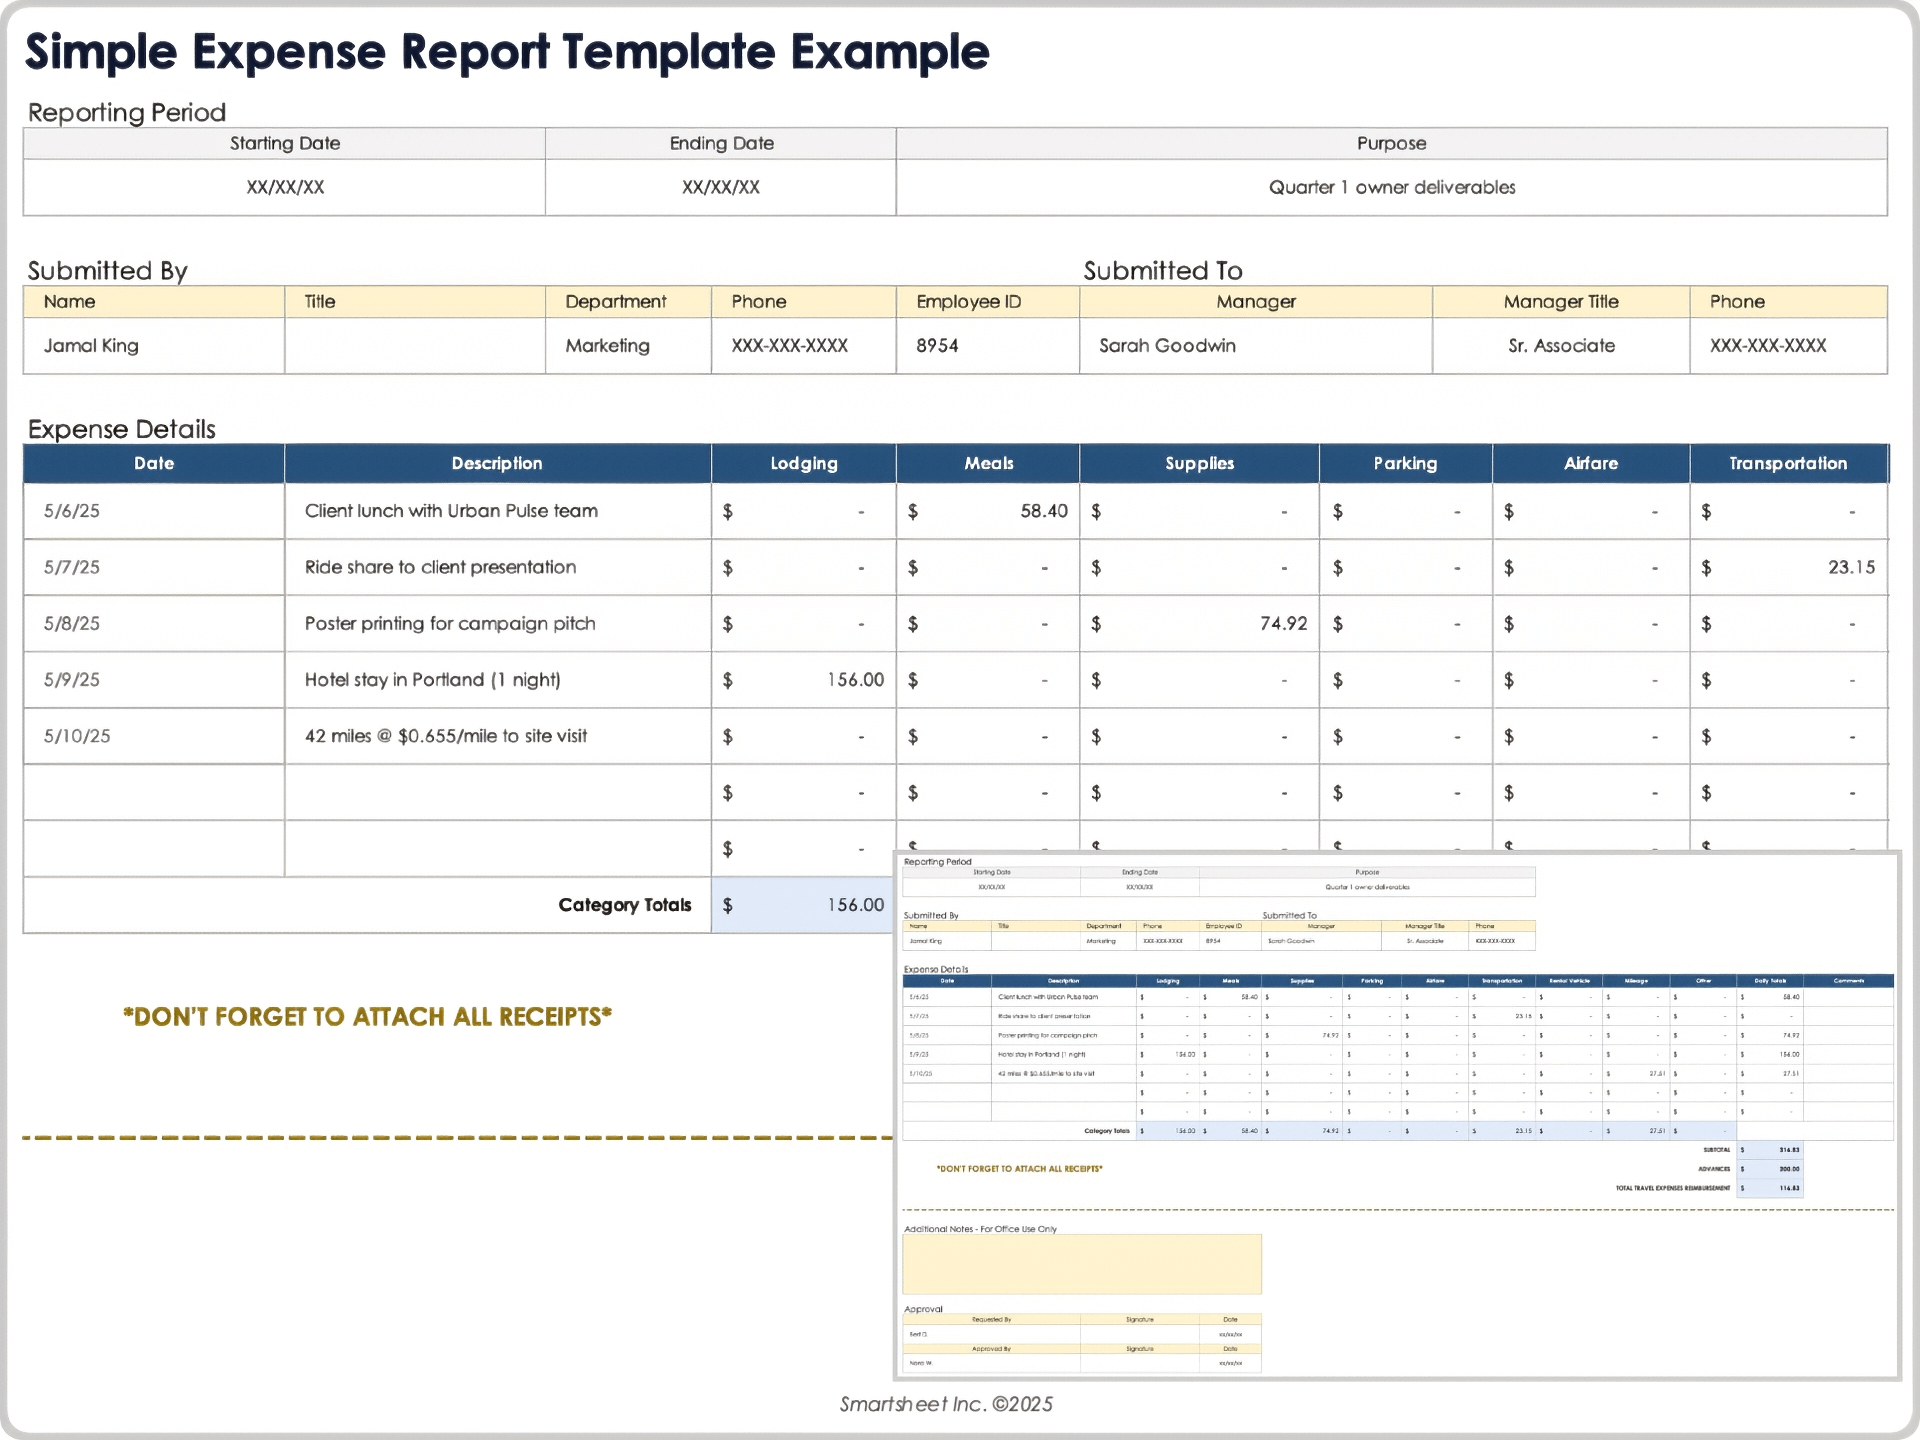
A marketing trade show expense report Template is easiest to evaluate when its structure can be compared with real reporting layouts. Useful visual references show how expense categories, dates, descriptions, totals, reimbursement details, and budget comparisons can be organized on a page or spreadsheet. The most useful examples are not necessarily identical to a trade show report; instead, they demonstrate individual design principles that can be adapted, such as clear line-item records, category totals, approval areas, variance fields, and monthly summaries. These references can help a marketing team decide which fields belong in the main event record and which details should remain in supporting financial records.
The following references provide different ways to visualize the financial structure behind a marketing trade show expense report Template . The trade show budget example demonstrates planned-versus-actual thinking, while the expense-report examples show how individual transactions can be organized and summarized. Comparing these layouts can help readers recognize useful patterns without assuming that any single format is an official standard. The best final structure should reflect the organization’s own accounting process, event goals, approval rules, cost categories, and reporting needs.
Trade Show Budget Overview
Source: ExhibitDay
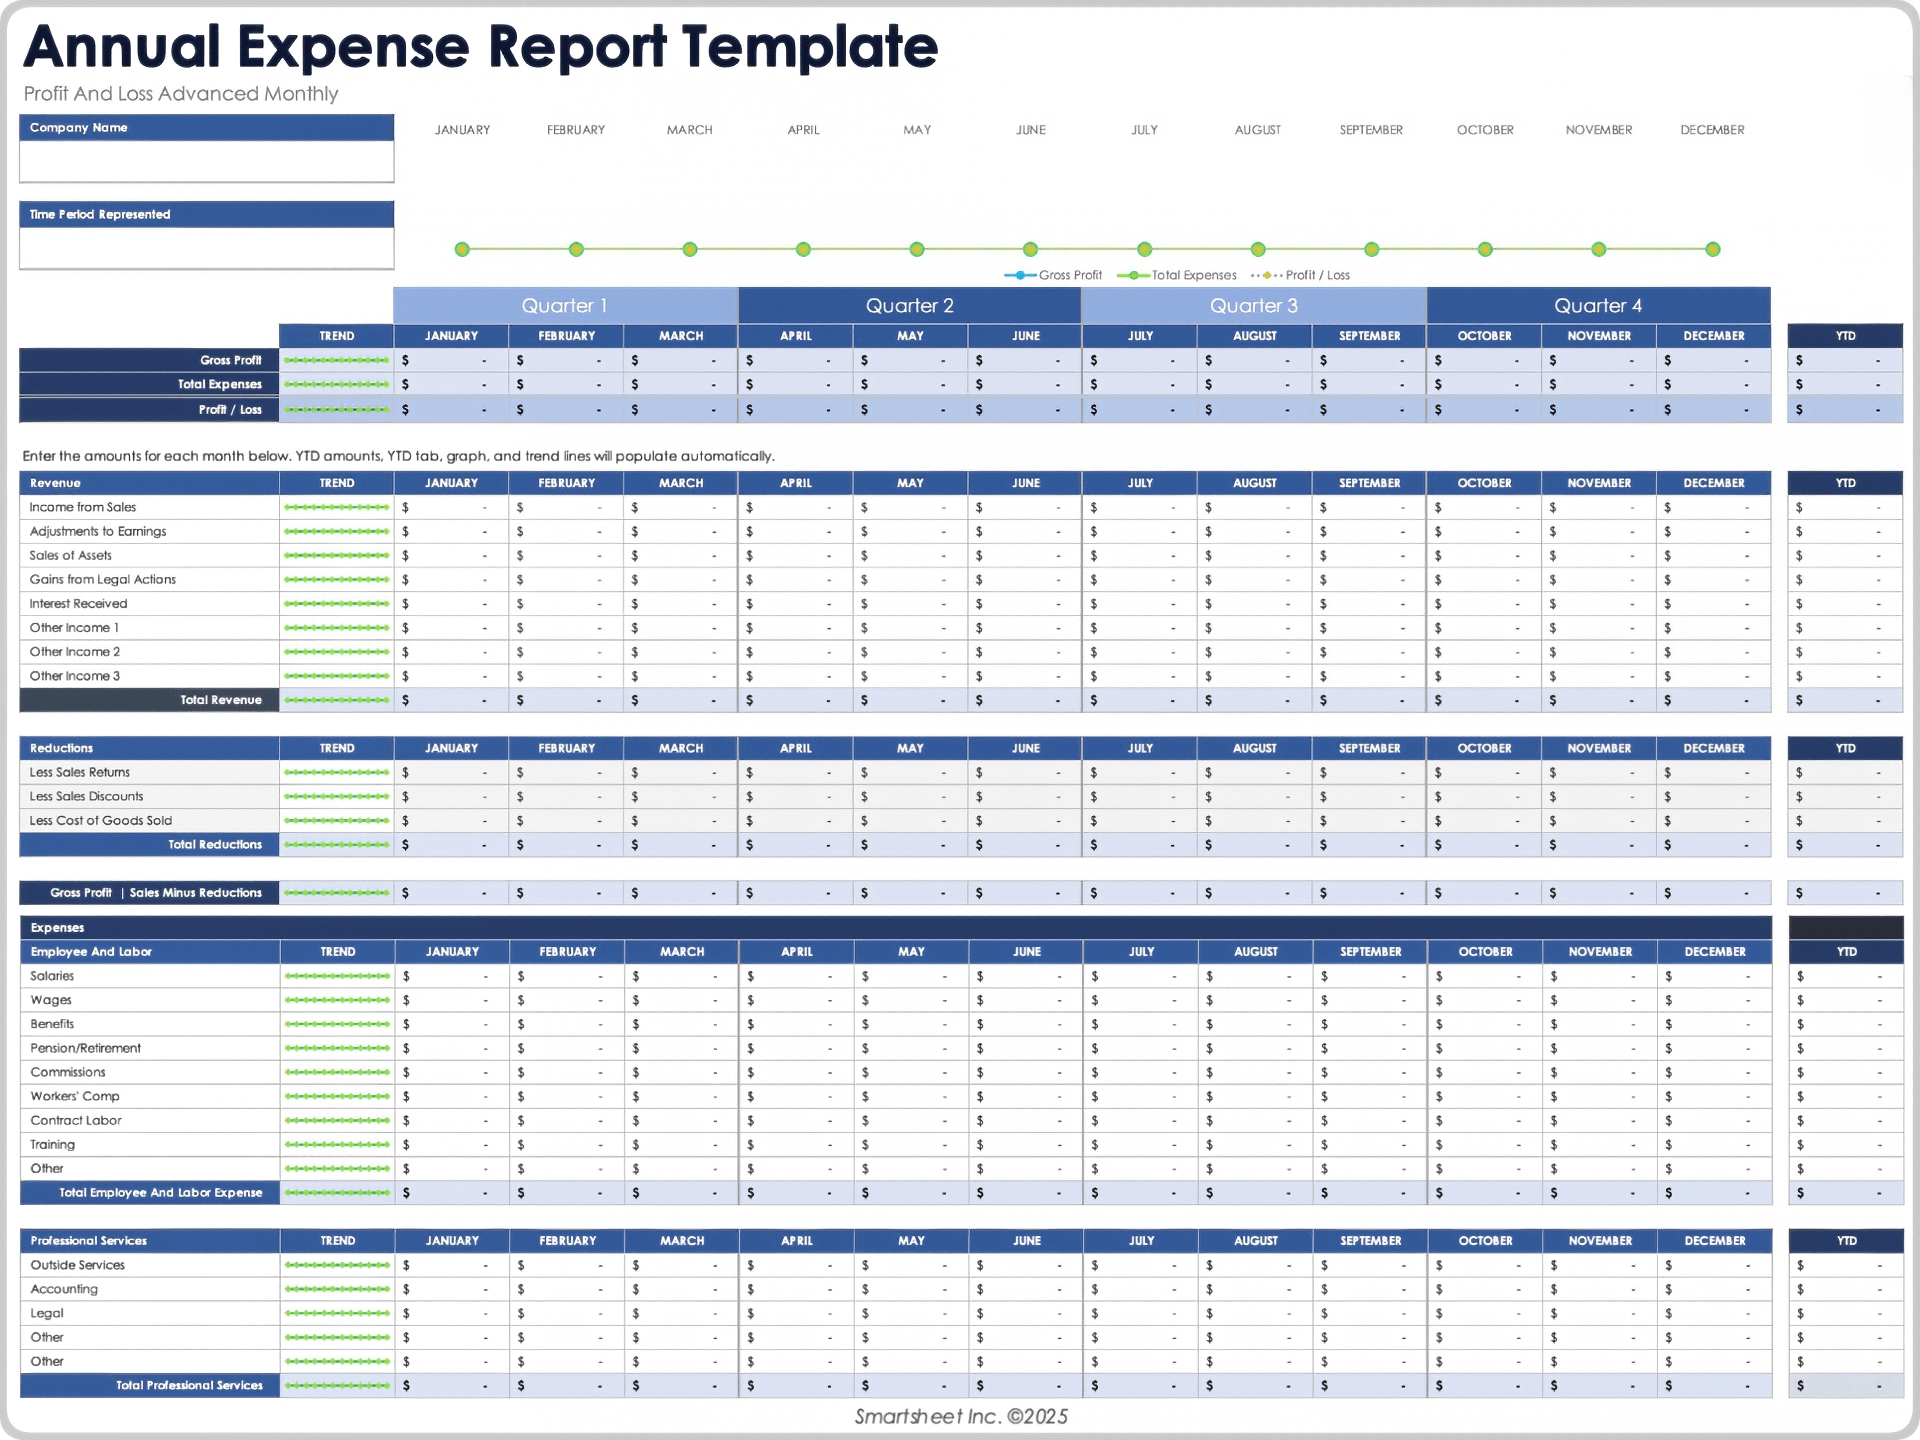
Annual Expense Report Template
Source: Smartsheet

Printable Business Expense Report Template
Source: Smartsheet

Weekly Expense Report Template Example
Source: Smartsheet

Personal Expense Template by Month
Source: Smartsheet

Petty Cash Expense Report Template
Source: Smartsheet

Daily Expense Report Template
Source: Smartsheet

Expense Sheet Template Example
Source: Smartsheet

Startup Expenses Template
Source: Smartsheet
