A well-structured marketing research mind Template can turn a scattered collection of questions, customer observations, competitor notes, market signals, and data sources into a logical research framework. Instead of treating market research as a long list of disconnected tasks, a mind map places the central research problem at the center and connects it to objectives, audiences, methods, evidence, analysis, and decisions. This makes the structure easier to review before research begins and easier to update as new findings emerge.
The strongest templates are not simply attractive diagrams. They help researchers decide what must be investigated, why the information matters, where evidence will come from, how participants or data will be selected, and how findings will influence a marketing decision. OpenStax describes a marketing research process that moves through problem definition, research planning, data collection, sampling, analysis and interpretation, and reporting. A useful mind map can represent these stages while also showing the relationships among customers, competitors, market conditions, and business objectives.
Searchers may also be looking for a marketing research mind template example because they want to see how the framework looks before creating their own. The most useful example is one that connects research questions to evidence rather than filling the page with generic labels. A practical map might place “new product launch” at the center, then branch into target customers, competitor positioning, pricing, purchase behavior, research methods, data sources, analysis frameworks, and recommended actions.

What a marketing research mind Template should accomplish
The main purpose of a marketing research mind map is to create research visibility. A conventional research document often presents information from top to bottom, while a mind map makes relationships visible from the beginning. A researcher can see that a question about declining sales may require customer interviews, competitor analysis, historical sales information, and segmentation analysis rather than one isolated survey.
A good template also protects the project from scope drift. Marketing research can easily expand because every new source seems to reveal another question. The map gives each question a place and makes it easier to decide whether that question is central, supporting, or outside the current project. This is particularly useful when several stakeholders have different expectations about what the research should accomplish.
The structure should ultimately connect research activity to a decision. If a branch contains “customer preferences,” it should lead toward specific questions, suitable evidence, an analysis approach, and a possible decision. If a branch only contains broad terms such as “customers” or “trends,” it is probably a category rather than a usable research element. Strong templates therefore encourage specificity without forcing the researcher into a rigid format.

Core branches to include in the mind map
A practical map usually begins with the research problem. This is different from a broad business ambition. “Increase sales” is a business goal, whereas “understand why repeat purchases are declining among a defined customer segment” is closer to a research problem. Starting with the problem prevents the rest of the map from becoming a collection of interesting but disconnected research topics.
The second major branch is the research objective. Objectives should state what the study needs to learn or determine. For example, a project could aim to identify the most important purchase criteria, compare customer perceptions of competing brands, assess the appeal of proposed product features, or understand barriers preventing trial. Clear objectives become filters for deciding which data belongs in the study.
The third branch can contain target audiences and market segments. Depending on the project, this may include existing customers, prospective customers, lapsed customers, channel partners, business buyers, decision-makers, or other relevant groups. A research map should distinguish these groups when their needs, behavior, or decision processes differ substantially.

Another important branch is research methodology. Primary research can include surveys, interviews, observation, experiments, or focus groups, while secondary research uses existing information gathered from appropriate external or internal sources. OpenStax distinguishes primary data collected for the current project from secondary information that already exists, and notes that the choice of research approach should follow the objectives and information requirements.
The map can then branch into competitor research, market conditions, customer behavior, pricing, distribution, and communication when those areas are relevant. These branches should not automatically appear in every project. A narrow study may need only customer attitudes and product evaluation, while a market-entry study may require broader competitive, geographic, regulatory, and channel analysis.
Turning research questions into a usable framework
Research questions are the bridge between the business problem and the data collection plan. A useful question is specific enough to guide evidence gathering. “What do customers think?” is too broad. “Which product attributes most influence initial consideration among first-time buyers?” is much easier to connect to a questionnaire, interview guide, or behavioral analysis.
Questions can be organized into several levels. Descriptive questions ask what is happening, such as which segments purchase most frequently. Diagnostic questions explore why a pattern may exist. Comparative questions examine differences between segments, products, or competitors. Predictive or decision-oriented questions consider what the evidence means for a future marketing choice.
The template becomes more valuable when every major question has a corresponding evidence branch. For example, a pricing question might connect to competitor prices, customer willingness-to-pay research, historical sales patterns, and interview feedback. This makes missing evidence visible before the research team spends time collecting data.

Frameworks such as SWOT or Porter’s Five Forces can sit underneath the competitive-analysis branch, but they should support evidence rather than replace it. Porter’s Five Forces examines rivalry, supplier power, buyer power, substitutes, and new entrants, making it useful when the research question involves industry structure or competitive pressure.
A mind map should also distinguish questions from assumptions. An assumption is something the team currently believes but has not adequately tested. Turning assumptions into explicit nodes creates a useful research discipline: each important assumption can be marked as supported, contradicted, or unresolved once evidence is collected.

Choosing the right template format
Different formats work for different stages of marketing research. A visual mind map is strongest during problem framing, brainstorming, research planning, and synthesis because it shows relationships. A document format is usually better when the team needs detailed instructions, definitions, methodology notes, or a formal research plan. A spreadsheet is stronger for structured observations, coding, calculations, respondent records, and quantitative analysis.
That distinction explains why searches for marketing research mind template pdf, marketing research mind template excel, and marketing research mind template google sheets can all make sense even though the underlying research logic is similar. The best format depends on the job. A PDF-style visual may be useful for review, while a spreadsheet may be more practical when the map must connect to structured research records.
Likewise, marketing research mind template google docs can be useful when the research team needs explanatory text alongside the visual framework. A document can contain the research problem, objectives, questions, definitions, methodological notes, and reporting plan while the mind map provides the high-level architecture. The two formats can complement one another rather than competing for the same purpose.

A marketing research template pdf can be particularly useful as a fixed review version because stakeholders can inspect the same structure without changing the working research model. The important point is not the file type itself. The value comes from whether the template preserves the connection between research objectives, questions, methods, evidence, analysis, and decisions.
Designing the data collection branch
Data collection should be represented as a planned system rather than a generic label. The map can divide data collection into primary and secondary sources, then identify the specific source or method under each. For primary research, useful nodes may include survey, interview, observation, experiment, or focus group. For secondary research, nodes may include internal records, published industry material, public datasets, company reports, or other credible sources.
Sampling deserves its own branch because the people or records included in a study affect what can reasonably be inferred. The map should specify the target population, sampling approach, eligibility criteria, and intended sample size where those decisions are known. A research project can have excellent questions but still produce weak evidence if the selected sample does not match the population relevant to the decision.
The research team should also record how information will be captured. For a survey, this might include question wording, response scales, screening questions, and completion rules. For interviews, it might include a discussion guide, recording procedure, coding approach, and consent process. The template should make these operational details visible enough that another researcher can understand how the evidence was produced.

Digital research workflows can reduce manual handling, but efficiency should not be confused with quality. A rapidly collected dataset is not automatically representative or reliable. The map should therefore include quality checks such as duplicate-response screening, missing-data review, source credibility checks, coding consistency, and documentation of important methodological limitations.

Organizing market and customer analysis
Segmentation is one of the most useful branches in a marketing research mind map because it prevents the research from treating every customer as identical. Common segmentation dimensions include demographic, geographic, psychographic, behavioral, and needs-based variables. The relevant dimensions depend on the research problem, so a template should make room for selecting only those that can contribute to a decision.
A segmentation branch should lead to evidence about how groups differ, not simply a list of categories. For example, if a company suspects that frequent purchasers and occasional purchasers have different motivations, the research can compare their purchase triggers, objections, preferred channels, and perceptions of value. The resulting map can then show which differences are supported and which remain assumptions.

Customer behavior can be analyzed alongside demographics rather than replacing them. A behavioral branch might include purchase frequency, product usage, switching behavior, response to promotions, preferred channels, and repeat-purchase patterns. Combining these dimensions can produce a more useful research picture than relying on a single demographic characteristic.

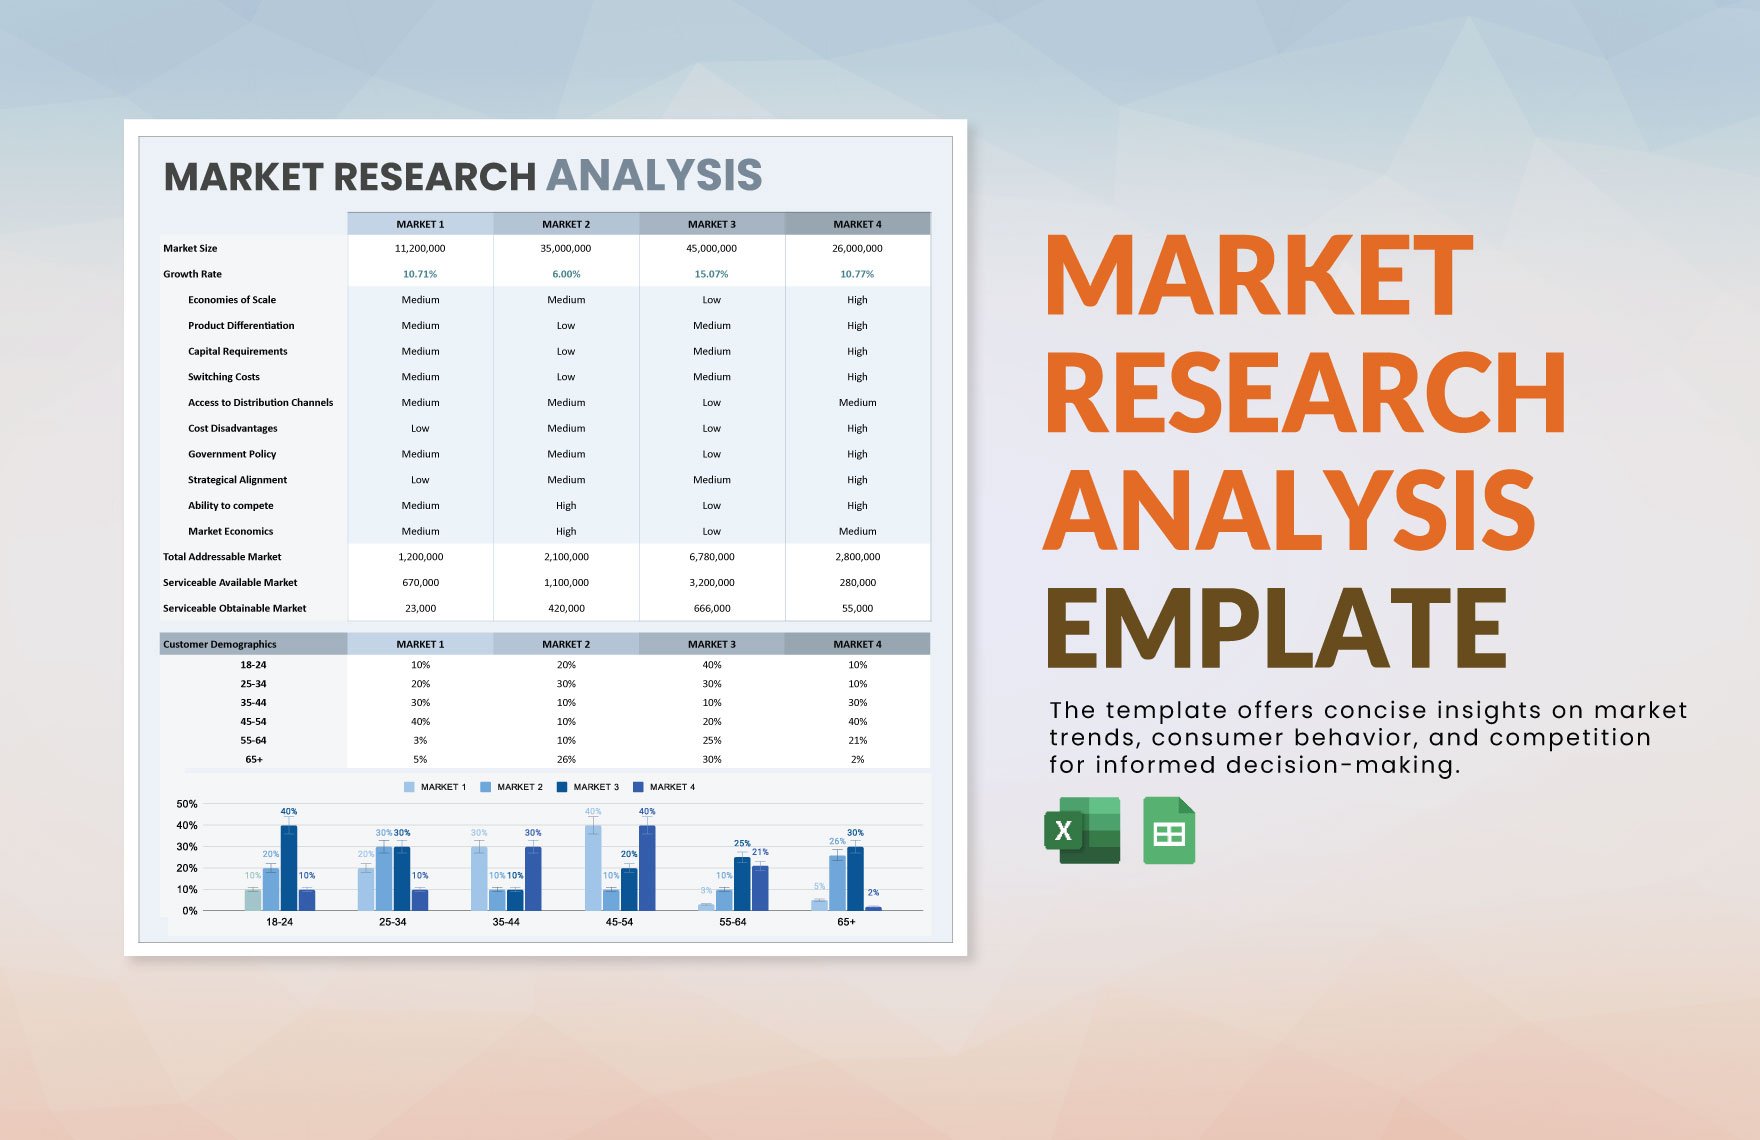
Market size and opportunity should be separated from customer description. A market may contain a large number of potential buyers but still be unattractive because competition is intense, access is difficult, switching costs are high, or the company’s offer does not fit the segment. A strong template makes these considerations visible so the research supports prioritization rather than merely describing the market.

Competitive research and opportunity evaluation
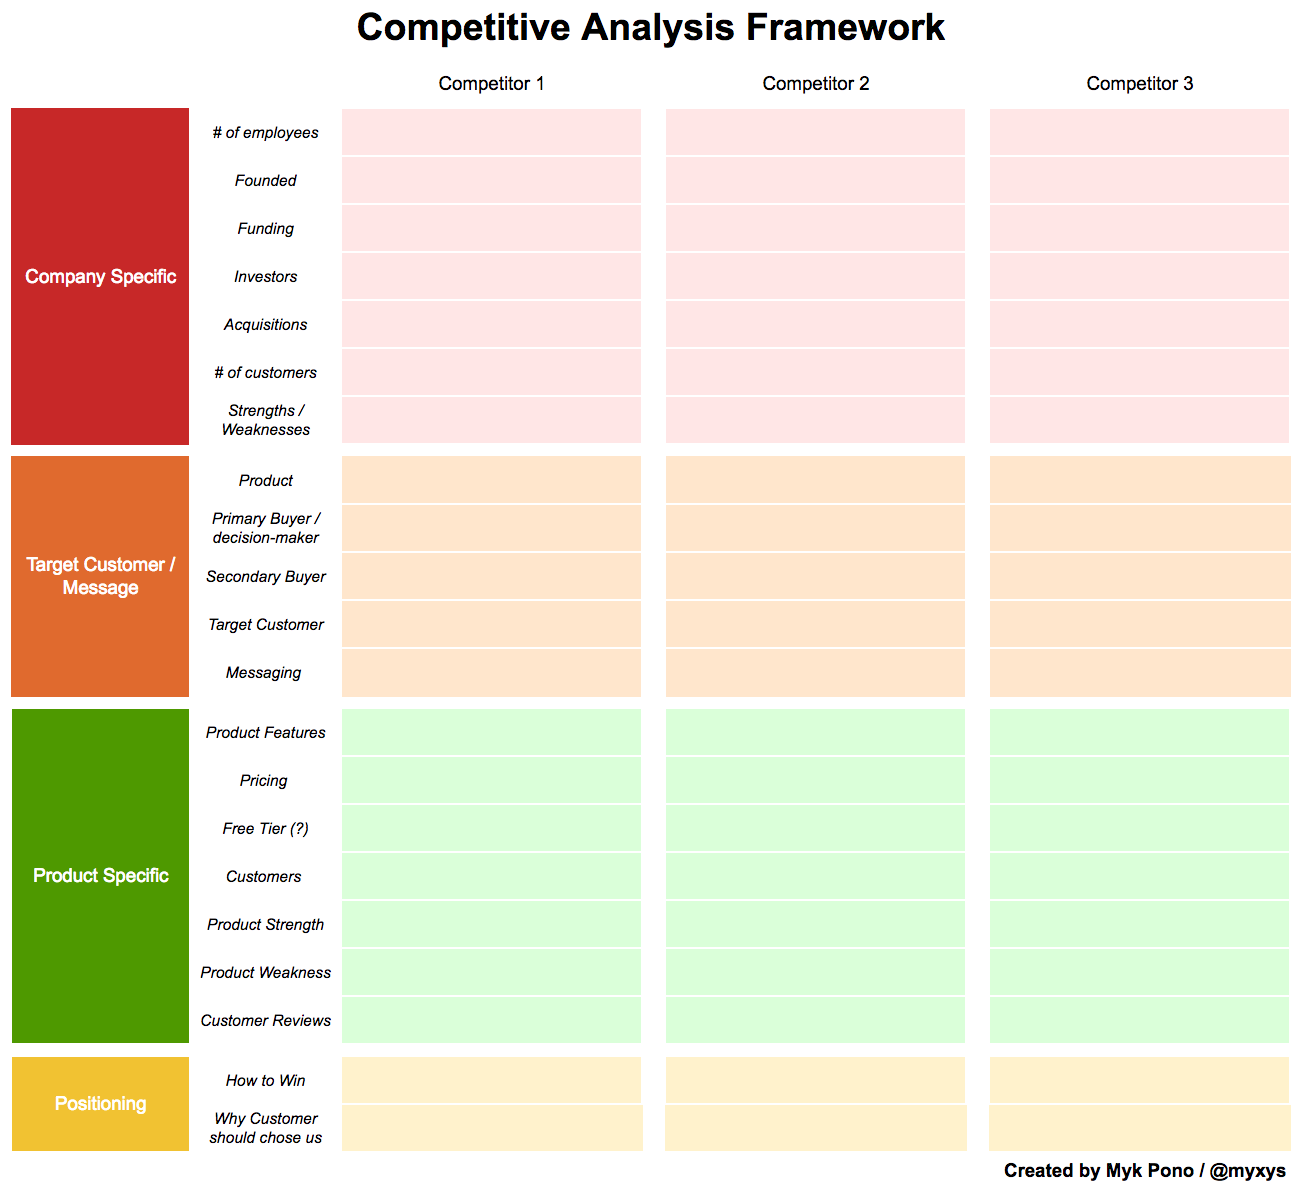
Competitive research should move beyond collecting competitor names. A useful branch records comparable dimensions such as target audience, positioning, product features, pricing logic, distribution channels, customer experience, strengths, weaknesses, and evidence of market traction. The purpose is to identify meaningful differences that could affect the research decision.
A structured opportunity scorecard can help compare several possible markets or strategic directions. The criteria should be selected in advance and should reflect the decision. For example, a hypothetical market-entry study might score opportunity size, growth potential, competitive intensity, accessibility, customer fit, and strategic alignment. The scores would be an internal evaluation model rather than an objective measurement of market reality.

Market entry research can then add geographic, regulatory, cultural, distribution, and competitive considerations. A scorecard is useful only when the criteria are defined clearly enough for different researchers to apply them consistently. If one person interprets “market attractiveness” as growth and another interprets it as profitability, the final score becomes difficult to defend.

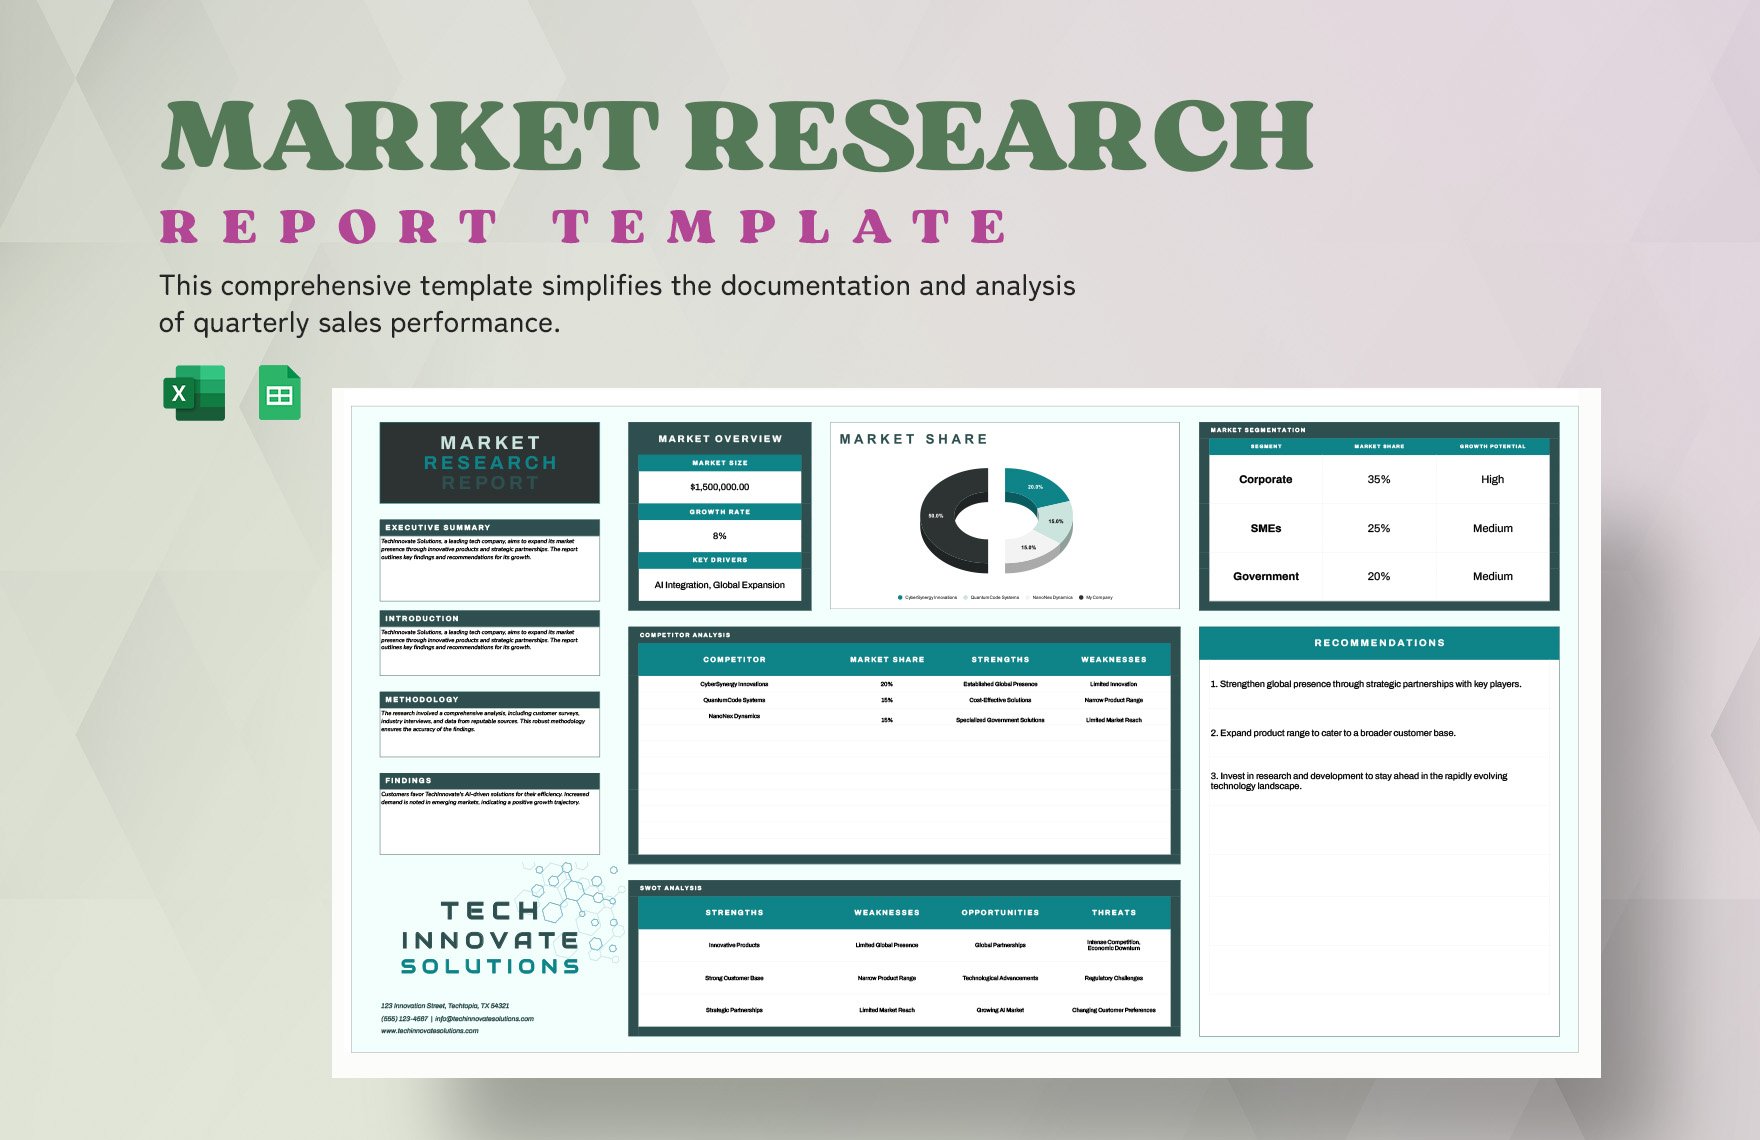
A sample for marketing research should therefore show not just a finished visual but also the reasoning behind its categories. Readers should be able to identify the research question, the evidence required, the analysis method, and the decision supported by the findings. A template becomes much more useful when it demonstrates this chain rather than presenting a decorative diagram.
Connecting findings to reporting and decisions
Analysis is where raw observations become meaningful findings. Quantitative research may involve frequencies, averages, cross-tabulation, comparisons, trends, or other appropriate statistical techniques. Qualitative research may involve coding themes, identifying repeated motivations, comparing groups, and examining contradictions. The exact method should follow the research question and the nature of the evidence.
The mind map can create a separate findings branch that links each major finding back to its source. This is valuable for traceability. A stakeholder should be able to ask why a recommendation was made and see which research question, evidence set, and analysis produced it. The branch can also distinguish strong findings from tentative interpretations.

Sentiment and feedback analysis can be useful when the research concerns brand perception, campaign response, or customer experience. These areas require careful interpretation because positive or negative mentions do not automatically explain causation. The map should therefore connect sentiment evidence to context, source, audience segment, and relevant research question.

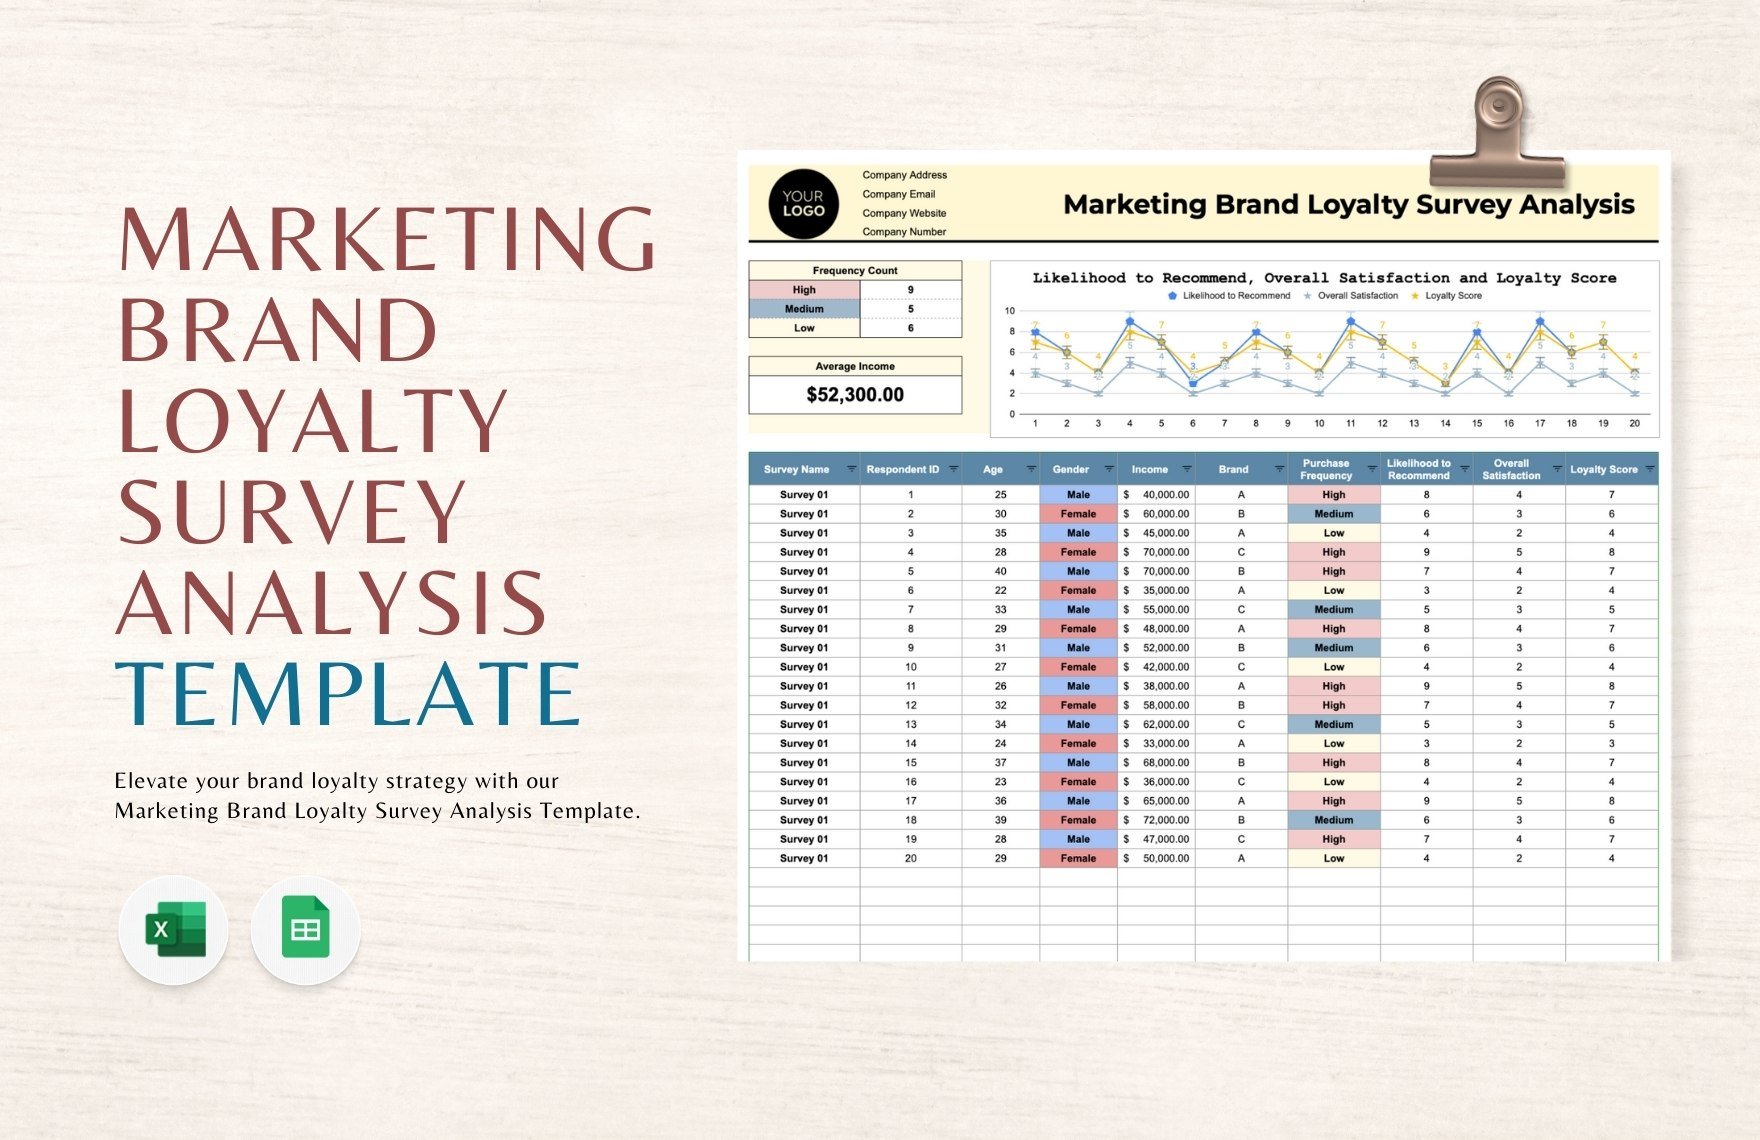
Customer feedback can also be organized around actions. Instead of storing every comment as an isolated observation, researchers can group feedback into recurring themes, identify the affected segment, assess the strength of the evidence, and connect the theme to a possible response. This keeps the research focused on decisions without pretending that every comment represents the entire market.
Practical Solution
Start by writing one sentence in the center of the marketing research mind Template that describes the decision the research must support. Around it, create six primary branches: research problem, objectives, target audience, research questions, evidence and methods, and analysis and decisions. Keep the first version deliberately simple. The objective is to expose the structure of the study, not to capture every detail at the first attempt.
Next, expand each branch only when a new node answers a practical question. Under objectives, specify what must be learned. Under audience, define who matters and why. Under research questions, identify what the study needs to answer. Under evidence, identify the source or method that can answer each question. Under analysis, specify how the evidence will be interpreted. Finally, under decisions, state what could change depending on the findings. This creates a direct chain from business problem to research action.
For a reusable workflow, maintain one working version of the map and create a separate reporting version when the research is complete. During research, mark assumptions, evidence gaps, methodological constraints, and unresolved questions. After analysis, replace tentative nodes with supported findings and connect the strongest findings to recommendations. This approach prevents the template from becoming a static planning document and turns it into a record of how the research evolved.

For a formal project, the map can sit beside a detailed research plan. A useful marketing research plan example normally explains the problem, objectives, information requirements, research design, data collection, sampling, analysis, timetable, and reporting. OpenStax identifies a seven-stage research process that includes defining the problem, developing the plan, selecting data collection methods, designing the sample, collecting data, analyzing and interpreting information, and preparing the report. :contentReference[oaicite:3]{index=3}

When selecting a working format, use the visual map for relationships, the document for explanation, and the spreadsheet for structured records and calculations. This division makes it easier to keep the research understandable without forcing every piece of information into one format. It also makes collaboration easier because different stakeholders can review the level of detail appropriate to their role.
How to adapt the template for different research projects
For a product launch, place the proposed product or decision at the center and branch into target users, unmet needs, competing alternatives, product attributes, price expectations, purchase barriers, communication, and launch risks. The research questions should then test the assumptions behind those branches. This structure can help a team distinguish between what customers say they want and what evidence suggests they actually value.

For an existing brand, the center can focus on a problem such as declining retention, weak differentiation, or inconsistent brand perception. Branches might include customer experience, satisfaction, loyalty, competitor positioning, brand associations, media feedback, and behavioral data. This approach keeps brand research connected to measurable business questions instead of turning it into a collection of opinions.

For a content or communication study, the map can focus on audience needs, message themes, channel behavior, content performance, competitor messaging, sentiment, and feedback. The purpose is not to make every research project look identical. The central principle is to preserve the relationship between the decision, questions, evidence, analysis, and action.

For geographic research, add branches for locations, market size, local customer characteristics, distribution access, competition, cultural factors, and regional performance. Geographic segmentation becomes especially useful when national averages hide meaningful differences between markets. The map should make those differences visible and show which regional evidence supports the proposed strategy.
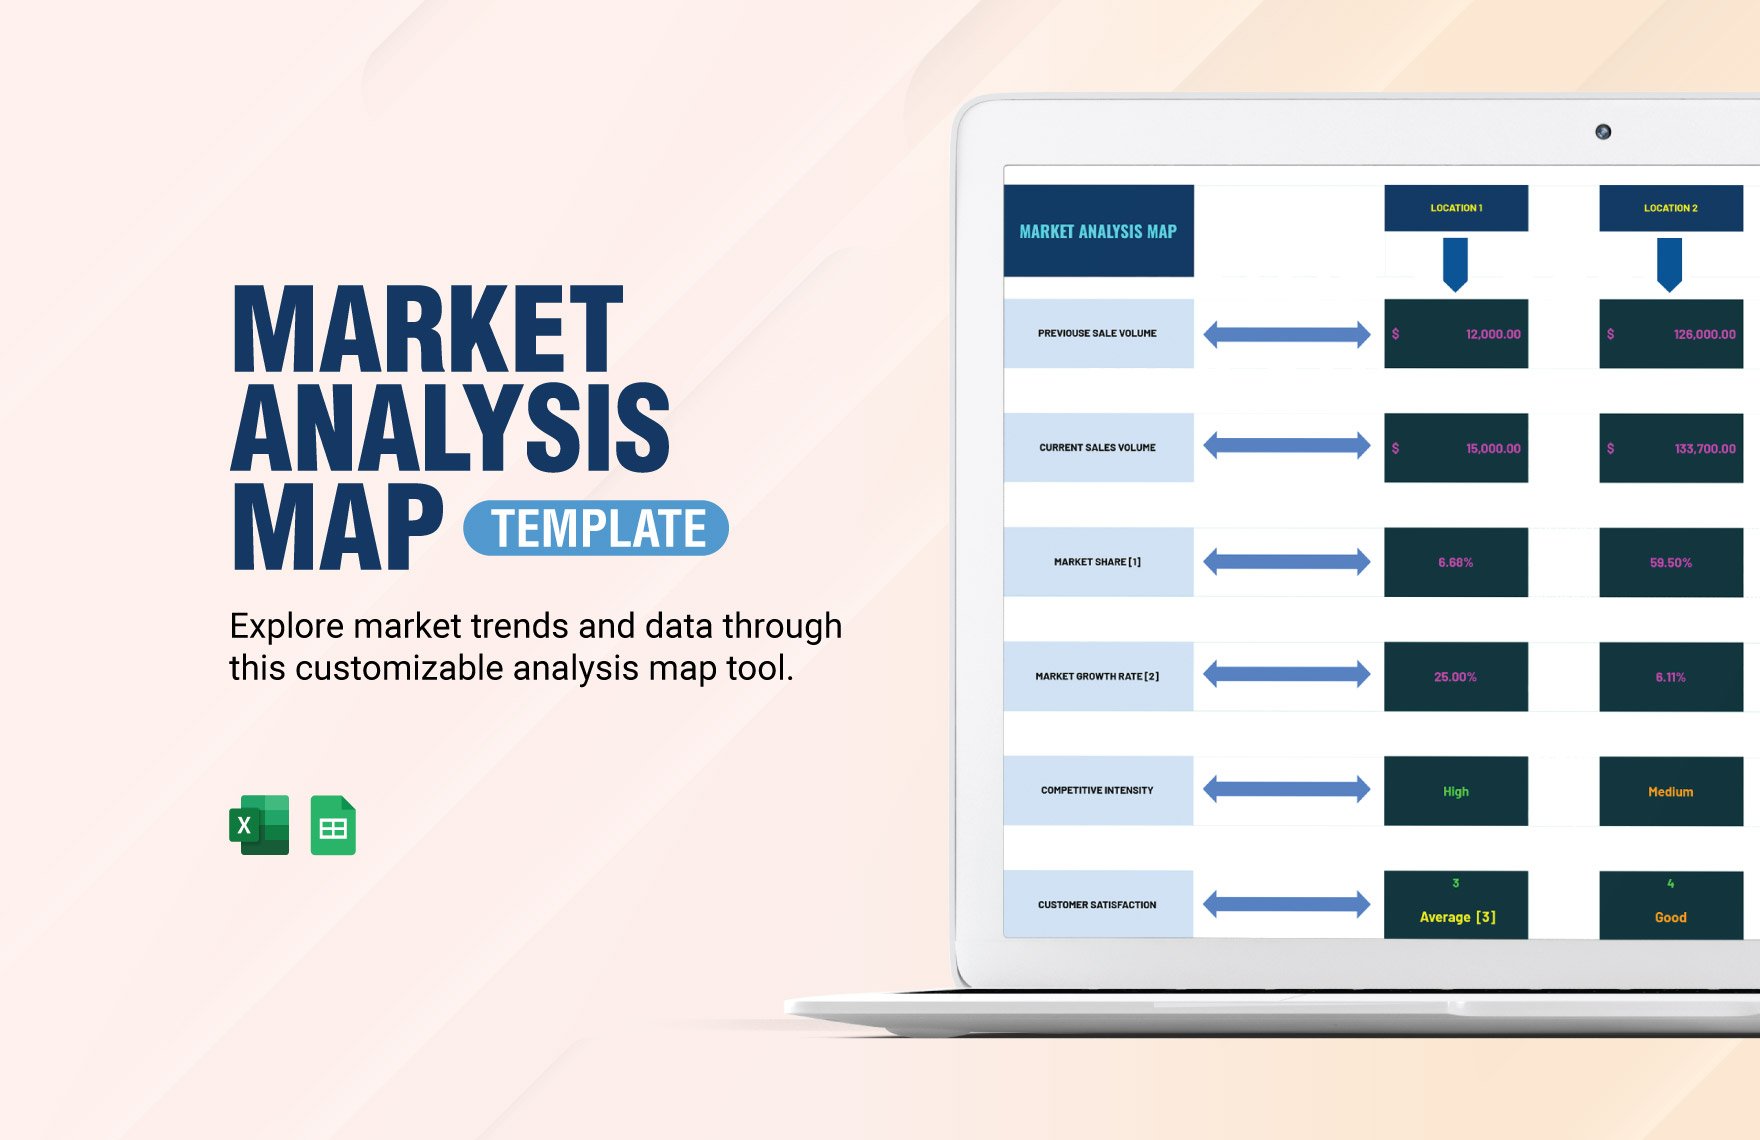
For campaign evaluation, the research map can connect objectives to exposure, audience response, feedback, sentiment, engagement, conversion, and post-campaign behavior. It should distinguish descriptive performance metrics from research findings about why a campaign performed as it did. This distinction helps avoid treating correlation as proof of causation.

Common mistakes when using a marketing research mind Template
The first common mistake is creating a map that is too broad. A page containing every conceivable research category may look comprehensive but can be difficult to execute. The better approach is to begin with the decision and include only branches that can influence it. A narrow, evidence-based map is usually more useful than a large collection of generic research terms.
The second mistake is confusing data with insight. A list of survey responses, competitor prices, or market figures is evidence, not automatically a conclusion. The map should show how information will be analyzed and what decision it could inform. If the research team cannot explain why a data source matters, that source may not belong in the core framework.
The third mistake is allowing assumptions to remain invisible. Every project contains assumptions, whether about customers, competitors, pricing, demand, or communication. Writing those assumptions into the map creates a clear testing agenda. It also makes the final report stronger because stakeholders can see which assumptions were supported and which were rejected.

Another mistake is failing to connect research to action. A useful template should eventually answer what the organization will do differently because of the research. Recommendations might involve changing a target segment, adjusting positioning, revising a product feature, testing a price, changing a channel, or gathering additional evidence. The recommendation should remain proportional to the strength of the evidence.

Best practices for maintaining research quality
Use consistent definitions throughout the map. If “customer” means an active purchaser in one branch and a website visitor in another, analysis can become confusing. Define important terms early, especially audience, market, lead, buyer, respondent, competitor, and research outcome when the project uses them.
Keep a clear distinction between verified evidence, interpretation, and hypothetical examples. If a number is an illustrative value used to demonstrate how a template works, label it as an example. Do not allow sample figures inside a visual framework to be mistaken for actual research results.
Document limitations directly in the research structure. These might include limited sample coverage, incomplete secondary information, self-reported behavior, timing constraints, or uncertainty about a market estimate. A professional research framework does not pretend that every finding has equal certainty.

Finally, review the map at three points: before data collection, during research, and before reporting. Before collection, check whether every objective has an evidence path. During research, identify gaps and unexpected findings. Before reporting, check whether each major recommendation can be traced to a question and credible evidence. This simple review cycle makes the mind map an active research control rather than a one-time planning graphic.

Reference Examples
A marketing research mind Template is most useful when its visual structure reflects the actual logic of a research project. The central topic should connect to objectives, research questions, audiences, methods, evidence, analysis, and decisions in a way that another reader can follow without additional explanation. Reference examples can help readers recognize useful layouts, compare different levels of detail, and identify which visual structures are appropriate for planning, segmentation, analysis, reporting, or strategic evaluation. The examples below focus on research-oriented layouts that can inform the design of a practical marketing research framework.
These visual references also show why there is no single correct structure for every marketing research mind Template. A questionnaire emphasizes questions and respondent inputs, a market analysis sheet emphasizes comparison, a coverage report emphasizes evidence and reach, and a segmentation model emphasizes groups and attributes. The useful lesson is to adapt the structure to the research decision rather than copying a layout mechanically. Each example can be evaluated for clarity, hierarchy, evidence organization, and how easily its components could be connected into a larger research workflow.

Startup Funding Round Analysis Template
Source: Template.net
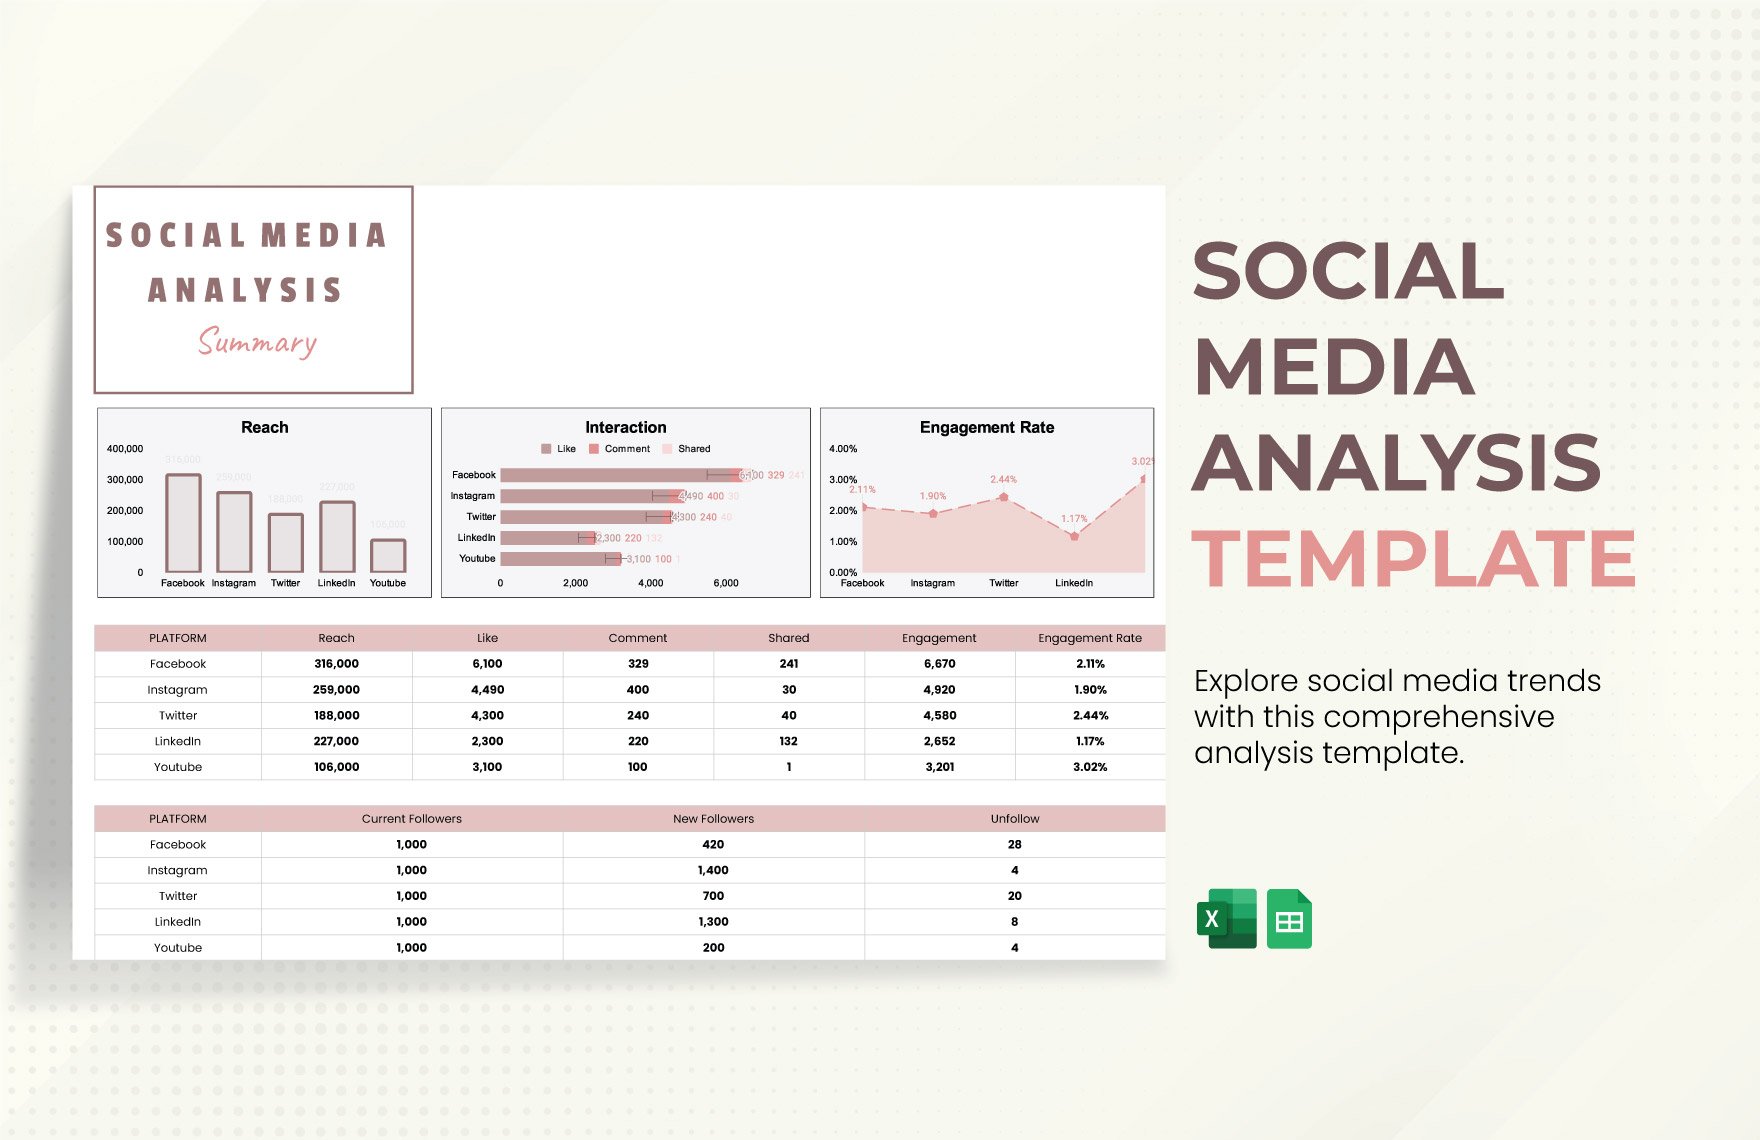
Social Media Analysis Template
Source: Template.net
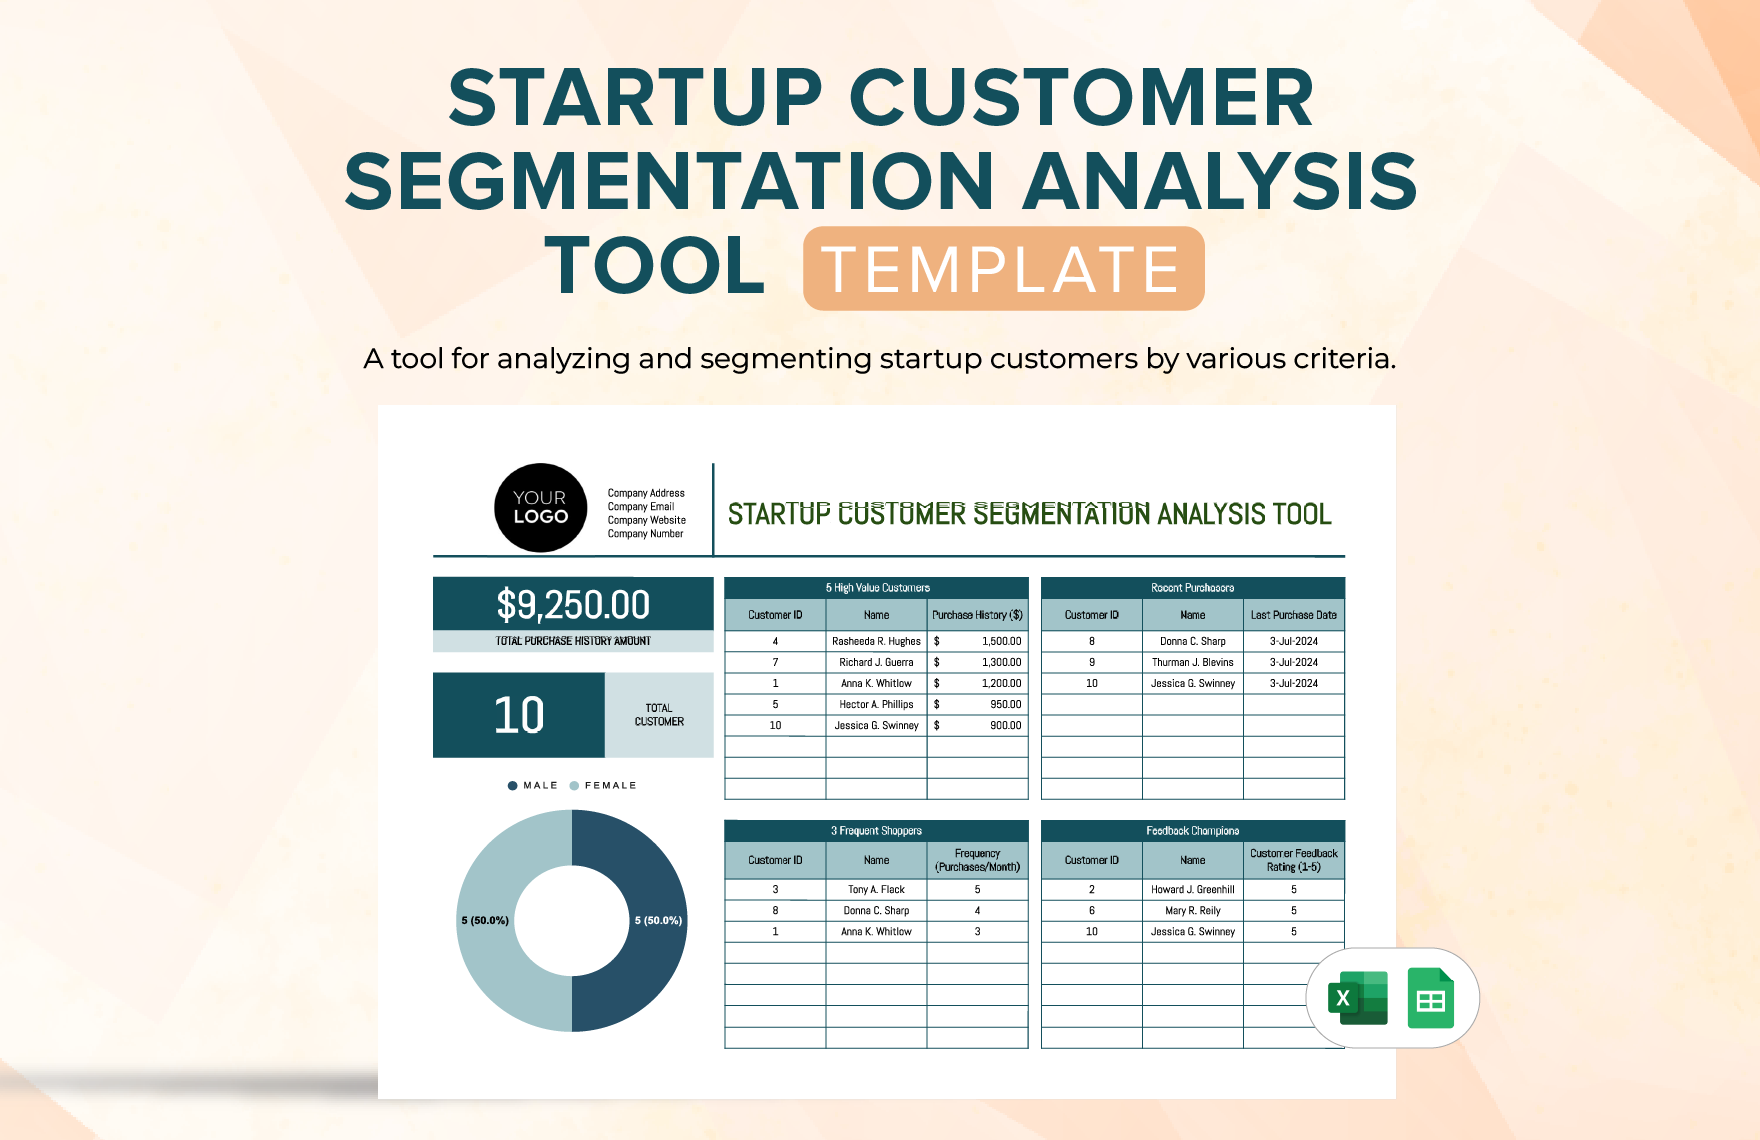
Startup Customer Segmentation Analysis Tool Template
Source: Template.net
Advertising Online Brand Sentiment Analysis Tool Template
Source: Template.net
Marketing Attendee Demographics Analysis Template
Source: Template.net

Marketing Media Coverage Analysis Template
Source: Template.net
Market Analysis Map Template
Source: Template.net

Marketing Trade Show Traffic Analysis Template
Source: Template.net
Marketing Niche Market Analysis Sheet Template
Source: Template.net
Sales Predictive Analysis Model Template
Source: Template.net
