A well-designed us states by mortgage origination Template helps turn mortgage-market records into a consistent state-by-state view of lending activity. The most useful version is not simply a ranking of states. It separates loan count from dollar volume, identifies purchase and refinance activity, records the reporting year, and preserves the definitions used to calculate each metric. That distinction matters because a state can rank highly by the number of loans while ranking differently by total dollar volume. Public HMDA data can support this type of analysis, while FHFA also publishes state-level statistics for new residential mortgages.
For readers searching for an us states by mortgage origination template excel structure, the central idea is a repeatable workbook with fields for state, reporting period, originated loans, dollar volume, average or median loan size, loan purpose, loan type, and source. A good template also keeps raw records separate from calculated rankings. That makes it easier to refresh the workbook when a new annual dataset becomes available and reduces the risk of overwriting source values with formulas.
The strongest state comparison starts by defining exactly what “origination” means in the analysis. HMDA distinguishes an originated loan from other outcomes such as a denial, withdrawal, or file closed for incompleteness. The CFPB describes mortgage origination services as activities involved in creating a mortgage, including taking the loan request, processing, underwriting, and funding. A state ranking therefore needs a clear data definition before numbers are compared.
What a state mortgage origination template should measure
A practical state-level model normally begins with two primary measures: number of originations and origination dollar volume. Loan count answers how many mortgages were originated, while dollar volume shows the total principal associated with those loans. Neither measure should automatically be treated as the “best” ranking. A lender studying operational workload may care more about loan count, whereas a market strategist may care more about dollar volume.
The next layer is normalization. A large state naturally has more potential borrowers, properties, and lenders than a small state. For that reason, a state ranking can be supplemented with originations per owner-occupied household, per population unit, or another clearly defined denominator. The denominator should be stated beside the metric because changing it can materially change the interpretation of the ranking.
Time also needs its own field. A workbook should identify whether the figures represent a calendar year, quarter, month, trailing period, or another interval. It should also record whether the dataset is preliminary, revised, or a fixed annual release. The CFPB’s HMDA Data Browser provides state-level filtering, while the FFIEC publishes annual HMDA data products that allow users to examine mortgage activity by geography and other characteristics.

How to structure the workbook
A useful workbook can be divided into four logical layers. The first is a source-data sheet containing imported observations without unnecessary manipulation. The second is a calculation sheet containing formulas for totals, averages, percentages, rankings, and year-over-year changes. The third is a state summary sheet designed for readers. The fourth is a methodology sheet explaining the source, reporting period, definitions, exclusions, and calculation rules.
Recommended fields include state name, state abbreviation, year, loan count, dollar volume, purchase count, refinance count, conventional count, government-backed count, average loan amount, median loan amount when available, denial rate when relevant, and lender count. You can also include a source field and a notes field. Keeping source information beside each dataset version makes later fact checking substantially easier.
Formatting should distinguish input values from calculated values. For example, imported loan counts should remain unchanged, while rank, share of national volume, average loan size, and year-over-year change can be formula-driven. A state summary can then sort automatically without changing the underlying observations. This design is especially useful when a researcher expects to update the workbook each year.

Choosing reliable mortgage origination data
HMDA is one of the most important public sources for state mortgage-market analysis. The FFIEC describes HMDA as a comprehensive source of publicly available information about U.S. mortgage-market activity. Its data products include loan-level information, aggregate reports, maps, and filtering tools. For state rankings, the analyst should identify the precise HMDA year and filter conditions used rather than combining figures from unrelated releases.
FHFA’s National Mortgage Database provides another useful perspective. Its new residential mortgage statistics include state-level datasets covering annual and quarterly periods. FHFA’s statistics can be valuable when the goal is to understand newly originated residential mortgages from a different statistical framework. The important practice is to avoid mixing definitions without documenting the difference.
Secondary market research can be useful for interpretation, especially when explaining why states differ in loan size, refinancing activity, or regional growth. However, a template should preserve the original source and methodology rather than copying a secondary ranking into a spreadsheet as if it were primary data. When two sources disagree, compare definitions, coverage, timing, and filtering before deciding that one source is wrong.

Understanding state-by-state rankings
A ranking based on dollar volume can be strongly influenced by housing prices and loan size. California, Texas, Florida, New York, and other large housing markets can therefore appear near the top for reasons that combine population, transaction activity, property values, and lending conditions. A high dollar ranking does not necessarily mean that borrowers in the state take out more loans per household.
Loan-count rankings tell a different story. They are useful for evaluating operational demand, lender reach, servicing pipelines, and borrower activity. A state with many smaller mortgages can rank above a state with fewer but much larger loans when the metric is the number of originations. For a professional report, showing both rankings is usually more informative than choosing only one.
Growth is another separate dimension. A state may have a smaller market today but experience stronger year-over-year expansion. Conversely, a large market can remain first in absolute volume while shrinking compared with the prior period. A state template should therefore preserve both the level and the change, allowing readers to distinguish market size from market momentum.
Purchase and refinance activity
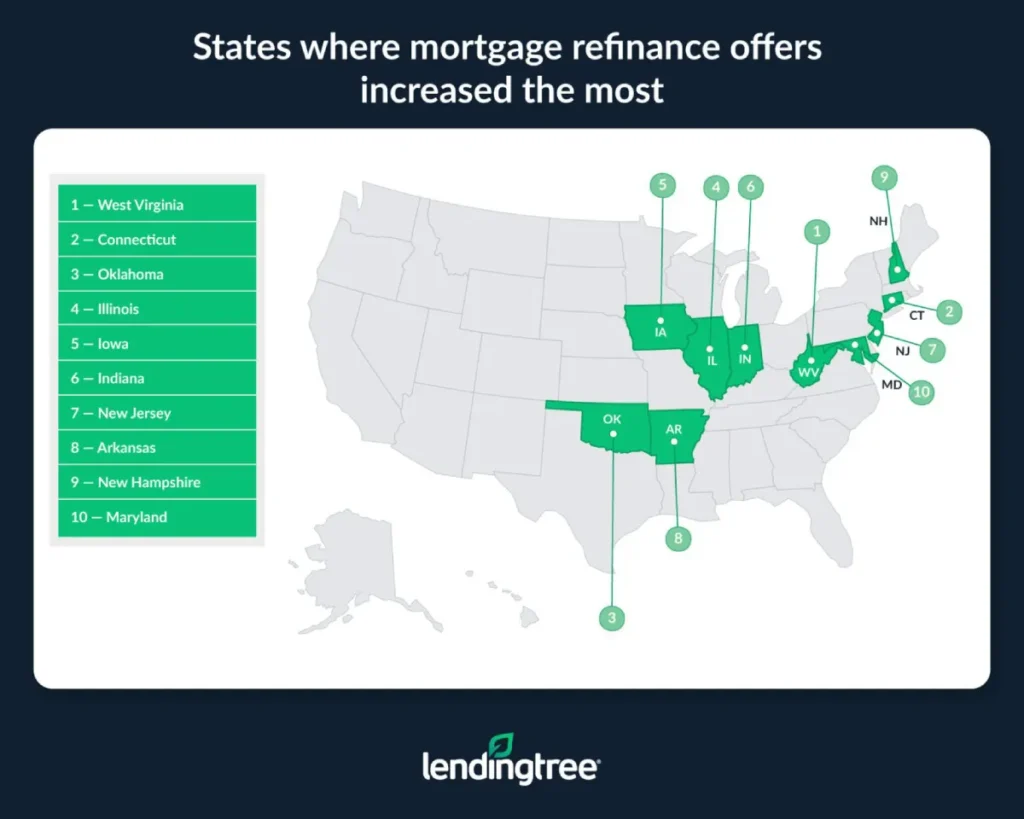
Mortgage origination analysis becomes more useful when purchase loans and refinance loans are separated. Purchase activity is closely connected with home sales and household formation, while refinance activity can change substantially as interest rates move. A state with a large installed mortgage base may generate meaningful refinance activity even when home-purchase activity is comparatively subdued.
When building a template, use separate fields for purchase originations, refinance originations, and other purposes when the source provides those categories. The workbook can calculate the purchase share and refinance share of total originations. Those percentages are easier to interpret when the underlying counts and dollar amounts remain visible beside them.
Refinance comparisons require particular care because one borrower can refinance an existing mortgage rather than create a net increase in household leverage. A report focused on housing-market demand should therefore avoid treating every origination as equivalent to a purchase transaction. The purpose field should remain part of the state-level model.

Connecting origination volume with mortgage loan documents
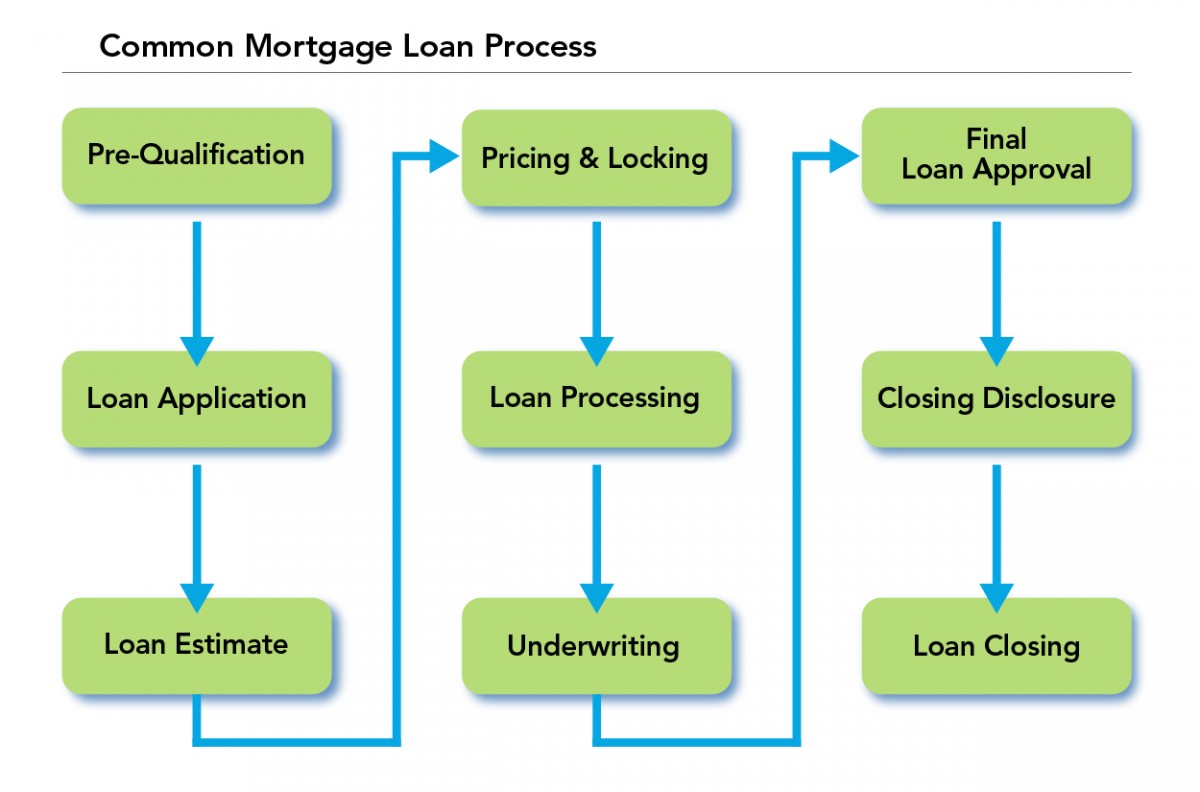
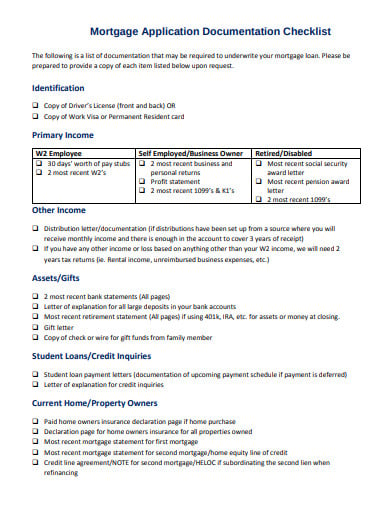
State-level market research and individual mortgage files answer different questions, but they intersect during loan origination. Researchers who search for us mortgage origination documents are often trying to understand which records explain the transition from a loan request to a completed mortgage. Common records include the Loan Estimate, Closing Disclosure, promissory note, mortgage or deed of trust, title records, insurance evidence, and underwriting materials.
The CFPB explains that borrowers should expect both federally required disclosures and contractual documents. The Loan Estimate communicates important estimated terms and costs, while the Closing Disclosure presents final loan terms and closing costs. The promissory note establishes the repayment obligation, and the mortgage or security instrument gives the lender an interest in the property securing the debt.
These documents should not be confused with HMDA reporting records. A consumer’s closing package is a transaction file, while HMDA is a public reporting framework containing standardized fields. A state origination template may summarize HMDA information without reproducing private borrower documents. Keeping these categories separate helps protect privacy and keeps the analysis focused on market-level information.

Key documents used during mortgage origination
The phrase origination documents for mortgages can refer to several stages of the transaction. Early records establish borrower and property information. Processing records verify income, assets, credit, title, insurance, and other underwriting conditions. Final records document the agreed terms, repayment obligation, security interest, and settlement of the transaction.
The exact package varies by loan type, property, lender, jurisdiction, and transaction structure. A conventional purchase may involve a different set of supporting records than a refinance, government-insured loan, investment property, or transaction involving unusual title circumstances. A template should therefore use categories rather than pretending that every mortgage file contains exactly the same documents.
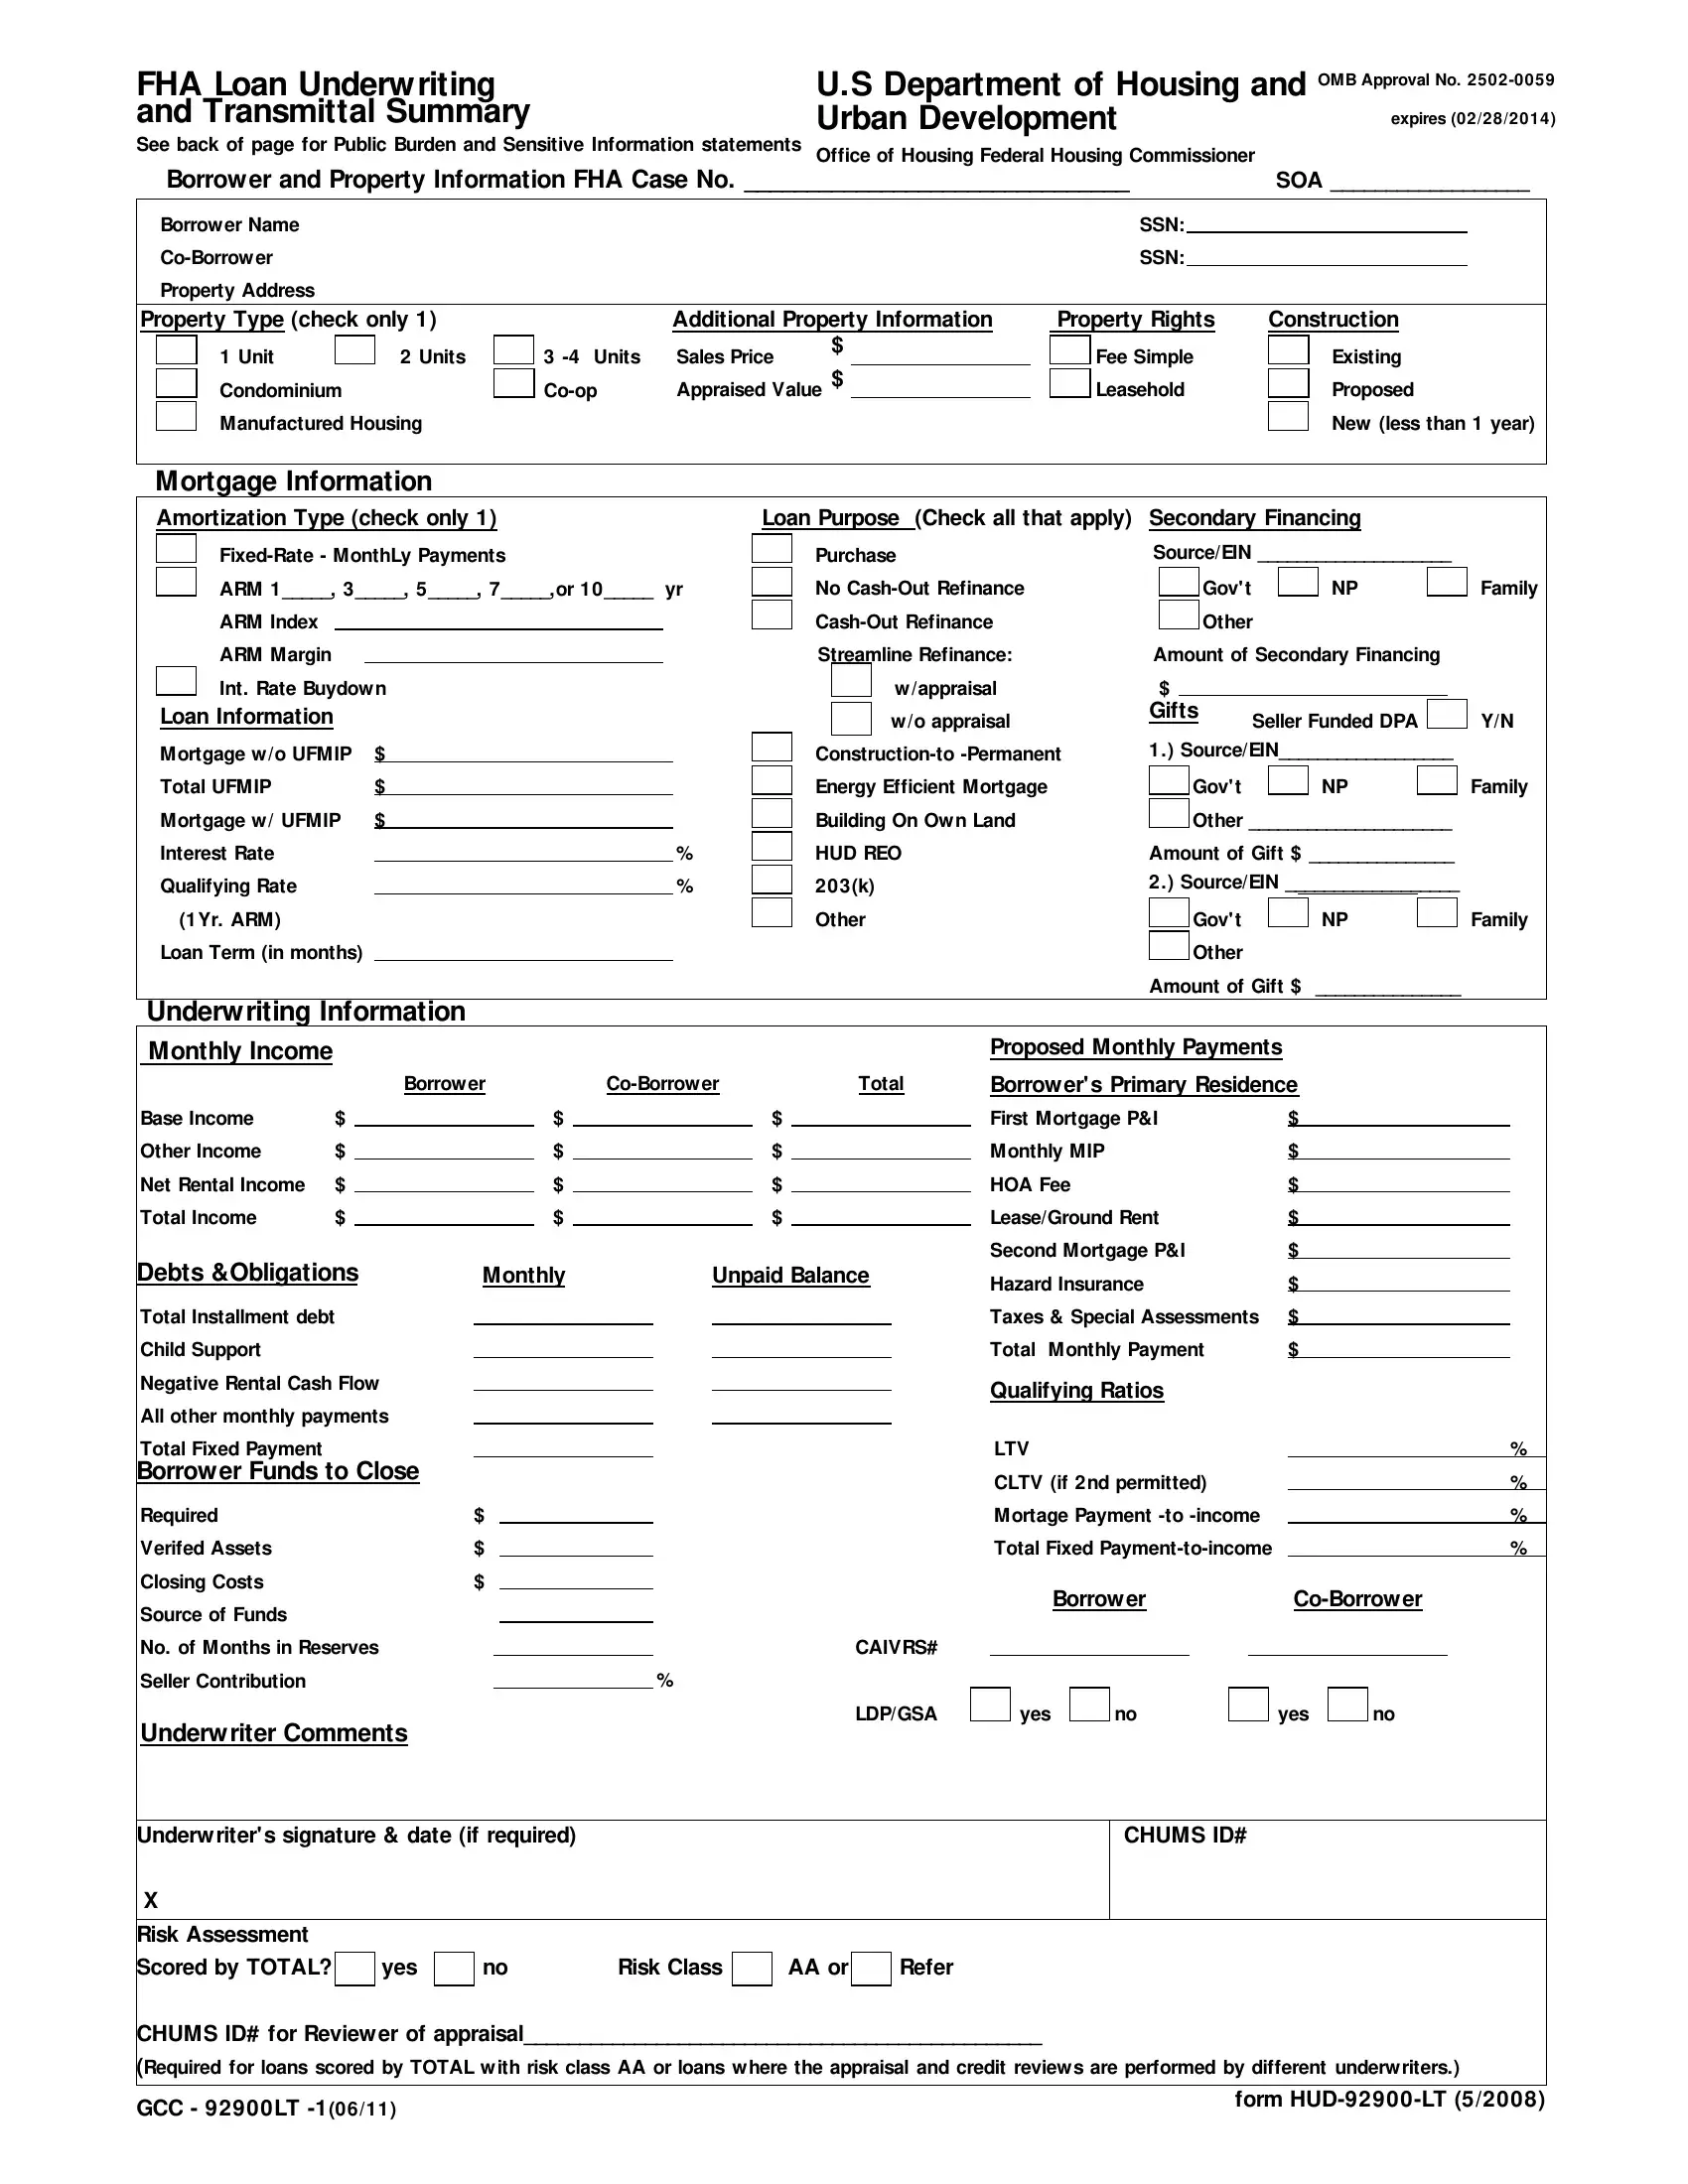
For analysts, document categories are useful as checkpoints. A state-market workbook does not need personal borrower data, but a process map can identify where loan disclosures, underwriting records, property valuation records, title materials, insurance evidence, and closing documents fit into the broader origination lifecycle. This creates a useful bridge between market statistics and the operational process behind them.

What is the mortgage origination date?
People asking what is the mortgage origination date are usually trying to identify the date on which a mortgage was formally originated rather than the date they first contacted a lender. The exact date displayed on a record depends on the document or dataset being examined. A loan may have an inquiry date, request date, disclosure date, closing date, funding date, recording date, and other milestones.
For a state-level market analysis, the relevant date should be the date definition used by the source. HMDA reporting contains standardized dates and action information, while a consumer’s closing documents may contain several different dates. A researcher should not substitute the property recording date for the origination date without confirming that the source defines them as equivalent.
The distinction is important when calculating annual volume. If one record uses a funding date and another uses a recording date, transactions near the end of a year can move between reporting periods. A robust template records the source’s date definition in the methodology sheet and uses the same rule for every state and every year.

How to find mortgage origination date
For a consumer reviewing a mortgage file, how to find mortgage origination date starts with identifying which record contains the date needed for the intended purpose. Review the final closing package and look for clearly labeled transaction, closing, disbursement, or loan dates. If the question concerns public mortgage-market data, consult the dataset documentation instead of assuming that a date printed on a consumer document is the same field used by the reporting system.
The promissory note can contain a date associated with the obligation, while the Closing Disclosure includes transaction and closing information. The security instrument can have its own date and recording information. If a servicing statement shows a loan opening date, that date may be useful operationally, but it should not automatically be treated as the official origination date for every analytical purpose.
When dates conflict, document the reason for selecting one. For a research workbook, a simple “date definition” field can state whether the analysis uses the source’s origination field, closing date, funding date, or another specified measure. This prevents analysts from silently mixing dates across states.

Origination fees and state comparisons
The question average origination fee for mortgage by state needs careful definition because an origination fee is not necessarily a single standardized percentage that applies to every mortgage in a state. The CFPB explains that an origination fee is a charge from the lender for making the mortgage loan and that origination services can include processing, underwriting, funding, and related administrative work.
State comparisons can be distorted if one source reports lender fees, another reports points, and another combines multiple loan costs. The Loan Estimate and Closing Disclosure are therefore useful reference documents because they identify categories of charges. A state research model should specify whether the fee measure represents lender origination charges, points, total lender fees, median reported fees, or another defined amount.
For professional analysis, median fees can sometimes be more informative than a simple average because very large loans and unusual transactions can pull an arithmetic mean upward. The right choice depends on the purpose of the report. Whatever measure is selected, the unit, reporting period, loan population, and inclusion rules should be stated directly beside the result.

Building an Excel-style state ranking
A spreadsheet-oriented version of the us states by mortgage origination template excel concept should begin with a clean state list and standardized columns. One row can represent a state-year observation, allowing multiple years to coexist in the same dataset. This is generally more flexible than creating one worksheet for every year because formulas, charts, and filters can operate across the entire historical series.
Useful calculated fields include national share, rank by loan count, rank by dollar volume, average loan size, year-over-year volume change, year-over-year loan-count change, and purchase share. Each formula should reference source fields rather than manually entered values. If a source changes its methodology, the analyst can then identify which calculation layer needs adjustment.
A ranking sheet should also show the reporting period prominently. A state ranking without a year can become misleading when it is copied into presentations or reused in later research. For recurring work, use a version label such as “2024 HMDA state originations” or another source-specific description rather than an ambiguous label such as “latest data.”

Google Docs and Google Sheets style workflows
Readers searching for an us states by mortgage origination template google docs structure are generally looking for a narrative reporting format rather than a calculation engine. A document-based version works well for methodology notes, executive summaries, definitions, research assumptions, and explanations of unusual state-level movements. The actual numeric dataset should remain in a structured spreadsheet or database when possible.
An us states by mortgage origination template google sheets workflow is better suited to recurring rankings, filters, formulas, charts, and collaborative review. The same state-year data model used in a desktop spreadsheet can be reproduced in a cloud spreadsheet, provided that formulas and source references are preserved. The important point is not the platform but the consistency of the data structure.
A practical reporting workflow is to maintain one source-data sheet, one calculations sheet, one state-ranking sheet, one chart sheet, and one methodology sheet. The narrative document can then draw its figures from the ranking sheet. This separation makes it easier for another analyst to inspect the underlying values before a report is published.
Using mortgage data without overstating what it means
Mortgage origination volume is an indicator of lending activity, not a complete measure of housing-market health. A state can experience high mortgage volume while facing affordability challenges, and a lower-volume state can still have strong local housing conditions. Origination numbers should therefore be interpreted alongside property values, household characteristics, interest rates, inventory, and loan purpose when the research question calls for broader market context.
Another common mistake is treating a ranking as a causal explanation. If one state grows faster than another, the ranking alone does not establish why. Possible explanations may involve housing supply, migration, rates, borrower composition, property prices, lender competition, or changes in refinancing incentives. Those factors should be researched separately before being presented as explanations for a state-level movement.
Data quality also matters. HMDA records are reported by covered financial institutions, and public datasets are modified to protect borrower privacy. Coverage and reporting rules should therefore be reviewed before interpreting the figures as an exhaustive census of every mortgage transaction in every possible market segment.
Common mistakes in state origination templates
One frequent mistake is mixing loan counts and dollar amounts in the same ranking. A column labeled “mortgage volume” can mean either number of loans or total principal. Those are fundamentally different measures. The safest approach is to label them separately and never use an abbreviated heading that could be interpreted both ways.
Another problem is combining different years without documenting revisions. Annual mortgage data can be updated, corrected, or presented through different dataset versions. A professional workbook should retain the publication year, dataset name, retrieval date, and methodology notes. This creates an audit trail and makes it possible to explain why a historical figure differs from an earlier report.
A third mistake is treating all origination fees as interchangeable. Points, lender credits, underwriting charges, processing charges, and other closing costs can have different meanings. When comparing fees by state, define the fee category first, then select records that match the definition. Do not create a state ranking from mixed cost categories simply because they appear under a broad “fees” label.

Practical Solution
The most practical solution is to build the state mortgage workbook around a repeatable state-year data model. Start with a source sheet containing one observation per state and reporting period. Record the exact dataset name, source organization, reporting year, geographic definition, loan-action definition, and any filters. Do not overwrite source values with rankings or formulas. This creates a stable foundation that can be refreshed as new mortgage data becomes available.
Next, create calculated fields for loan-count rank, dollar-volume rank, national share, average loan size, purchase share, refinance share, and year-over-year change. Add validation checks that compare state totals with the national total where the source permits that comparison. Flag missing or suppressed values instead of treating them as zero. This is particularly important when producing a national ranking because a missing observation can otherwise appear to be a small market.
Finally, turn the calculations into a reader-facing report. Use one chart for loan count, one for dollar volume, one geographic visual for state variation, and a short methodology note explaining definitions. If the report includes mortgage documents, keep them as explanatory references rather than treating them as market-level observations. This workflow produces a state-by-state analysis that is easier to review, update, and defend.

Reference Examples
The us states by mortgage origination Template is most useful when the visual structure makes the relationship between geography, mortgage volume, reporting period, and measurement method immediately understandable. State maps are useful for showing geographic concentration or change, while document examples help explain the records that sit behind the origination lifecycle. A strong reference should therefore make it easier to recognize whether a visual represents loan count, dollar volume, rate conditions, underwriting information, closing costs, or another defined mortgage measure. The examples below emphasize those distinctions so that readers can evaluate a state mortgage template without confusing market statistics with individual loan records.
These visual references also show why a state-level mortgage workbook should combine quantitative structure with documentary context. A map can reveal regional differences, but a mortgage disclosure or underwriting form shows how a transaction is documented. When both perspectives are kept separate and clearly labeled, the resulting us states by mortgage origination Template can support market research, lender analysis, reporting, and historical comparisons without implying that one visual answers every mortgage question.

Closing Disclosure: Additional Loan Information
Source: Board of Governors of the Federal Reserve System

Closing Disclosure: Loan Calculations and Contacts
Source: Board of Governors of the Federal Reserve System
Closing Disclosure: Calculating Cash to Close
Source: Board of Governors of the Federal Reserve System
Closing Disclosure: Loan Terms and Projected Payments
Source: Board of Governors of the Federal Reserve System
Closing Disclosure: Closing Cost Details
Source: Board of Governors of the Federal Reserve System
Title Insurance Commitment Schedule A

Source: Scribd

Mortgage Life Cycle Document Overview
Source: Medium
Residential Mortgage Loan Underwriting Worksheet
Source: Pipefile
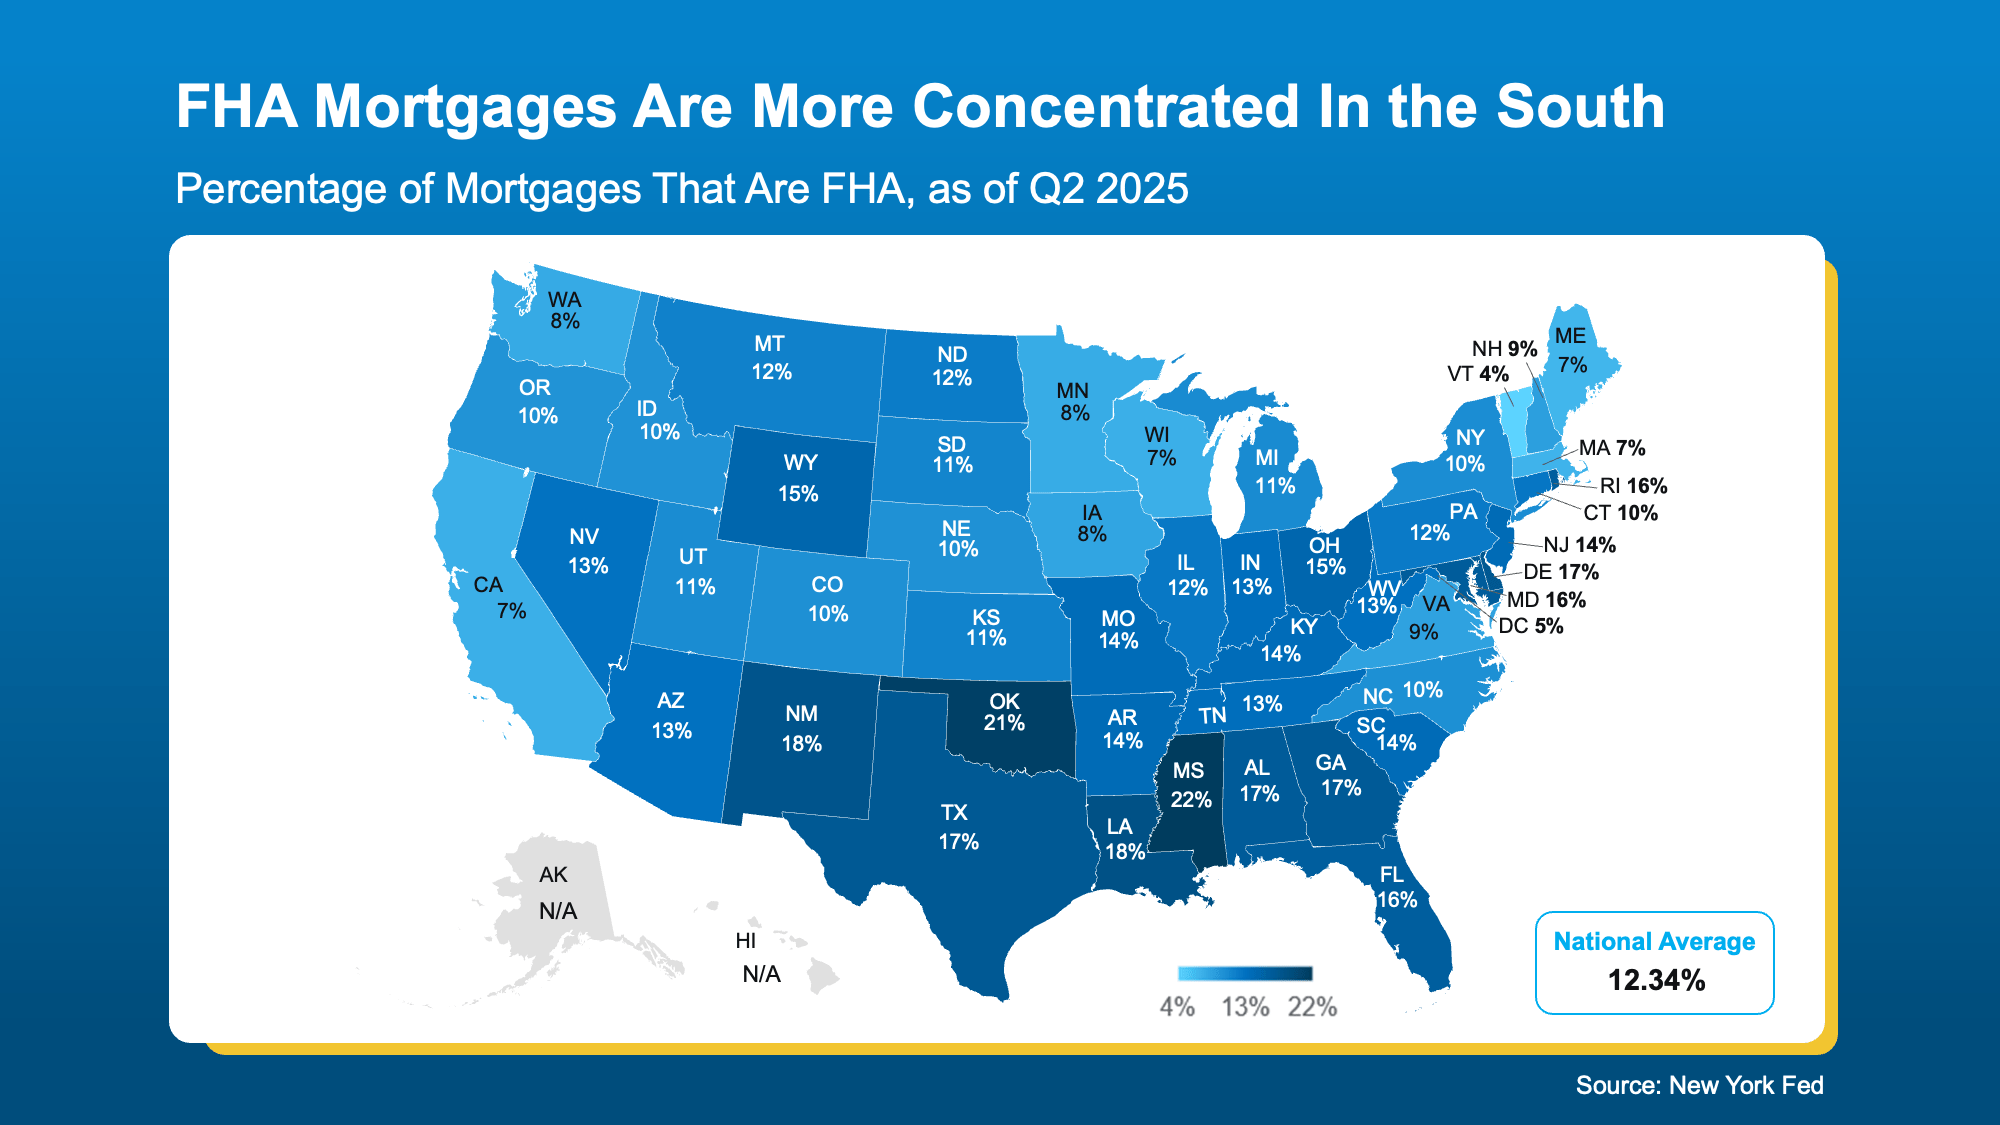
FHA Mortgage Concentration by State
Source: Keeping Current Matters
Rural–Urban Denial Rate Gaps by State
Source: Federal Reserve Bank of Minneapolis
